Free Stock market / Nifty intraday tips, FREE Stock, Commodity & Forex tips

NIFTY Outlook – Multiple Time-frame Analysis

Free nse nifty weekly charts calls

Weekly overview:

Free nse nifty weekly charts calls

The previous week’s closing price was strong enough to let traders think about a bull market, But is it the right time to be a bull trader?

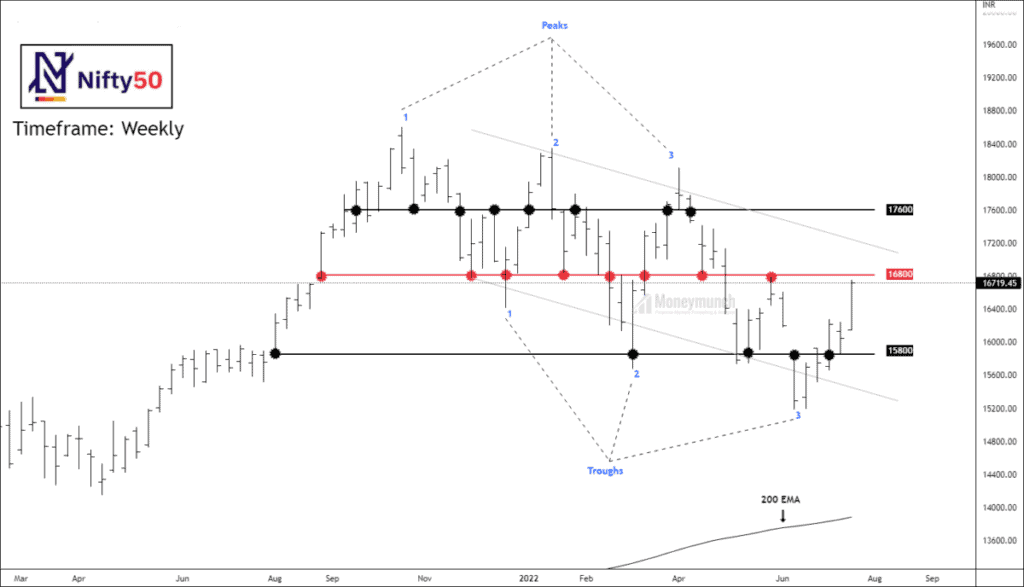
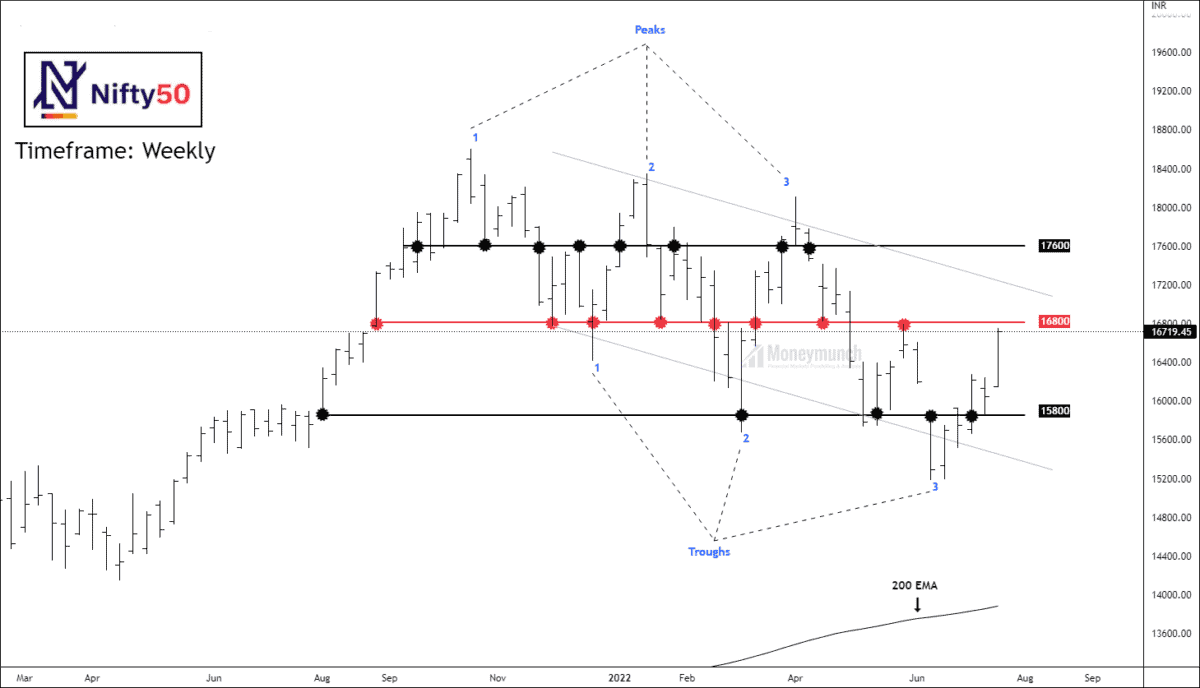
As you can see in the chart, we are getting some price levels very often, such as 15800, 16800 & 17600. It is the perfect example of the assumption of technical analysis, “History tends to repeat itself.”
Nifty has given eight touches at 16800, nine touches at 16600, and finally five touches at 15800.

Currently, the price is marching towards 16800, which is the resistance for now to the nifty.
If you notice like a hawk, there will be a conclusion that prices have reached 17600 after the breakout of 16800.
Let’s analyze and gather some clues from the lower time frame charts, but don’t forget to keep the bigger picture in mind.

Daily Overview:

free nse nifty daily chart calls

After analyzing the weekly chart, we have noted our levels. But prices don’t exactly fall from these levels. Indeed, 1 – 2% penetration is acceptable on the resistance.

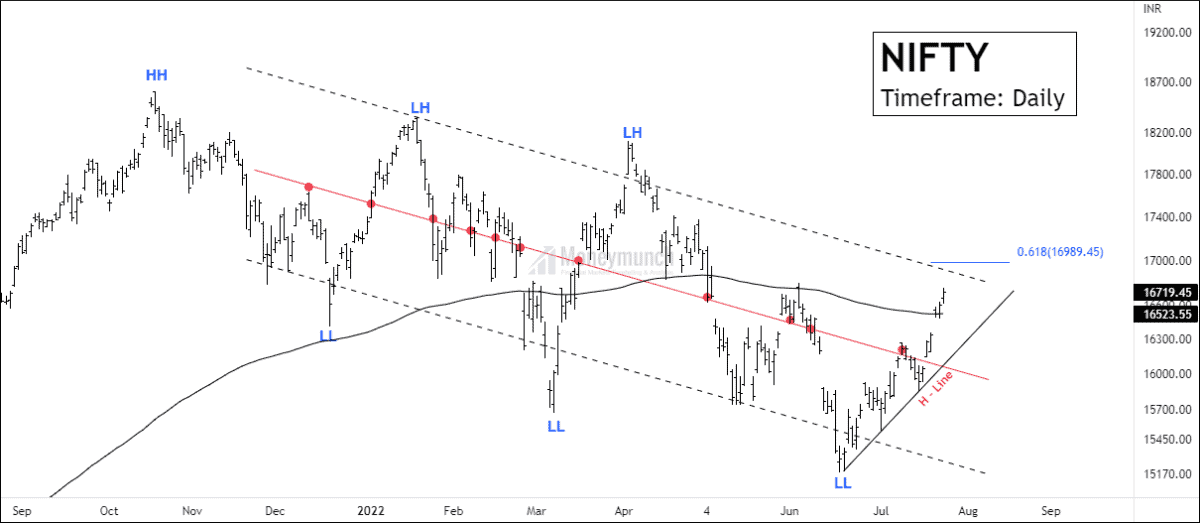
There are 3 price confluences zones for nifty:
1) The price is marching for the upper band of the parallel channel at 16931.
2) 16989 is 61.8% Fibonacci retracement of the previous move.
3) Price has broken out 200 EMA.

The parallel channel is valid with 8 lower band touches, 14 control line touches, finally 3 upper and touched. Please note that, sellers are strong at the upper band of the parallel channel.

Timeframe: Hourly

To become a subscriber, subscribe to our free newsletter services. Our service is free for all.

Get free important share market ideas on stocks & nifty tips chart setups, analysis for the upcoming session, and more by joining the below link: Stock Tips

Have you any questions/feedback about this article? Please leave your queries in the comment box for answers.

Disclaimer: The information provided on this website, including but not limited to stock, commodity, and forex trading tips, technical analysis, and research reports, is solely for educational and informational purposes. It should not be considered as financial advice or a recommendation to engage in any trading activity. Trading in stocks, commodities, and forex involves substantial risks, and you should carefully consider your financial situation and consult with a professional advisor before making any trading decisions. Moneymunch.com and its authors do not guarantee the accuracy, completeness, or reliability of the information provided, and shall not be held responsible for any losses or damages incurred as a result of using or relying on such information. Trading in the financial markets is subject to market risks, and past performance is not indicative of future results. By accessing and using this website, you acknowledge and agree to the terms of this disclaimer.
Previous ArticleNext Article
Mr.Guru(s) is a team of stock market certified technical and research analysts with over 20 years of experience. They are regular guests on popular online channels and contribute articles to several financial publications. Their insights and advice are respected by investors worldwide. With their collective knowledge and expertise, they have a proven track record of successfully predicting market movements and identifying profitable opportunities.

Join Today (Free): Stock & Nifty Tips

3 Comments

Write a Comment

Comment Policy: We love comments and appreciate the time that readers spend to share ideas and give feedback. However, all comments are manually moderated and those deemed to be spam or solely promotional will be deleted. Your email address will not be published. Required fields are marked *