
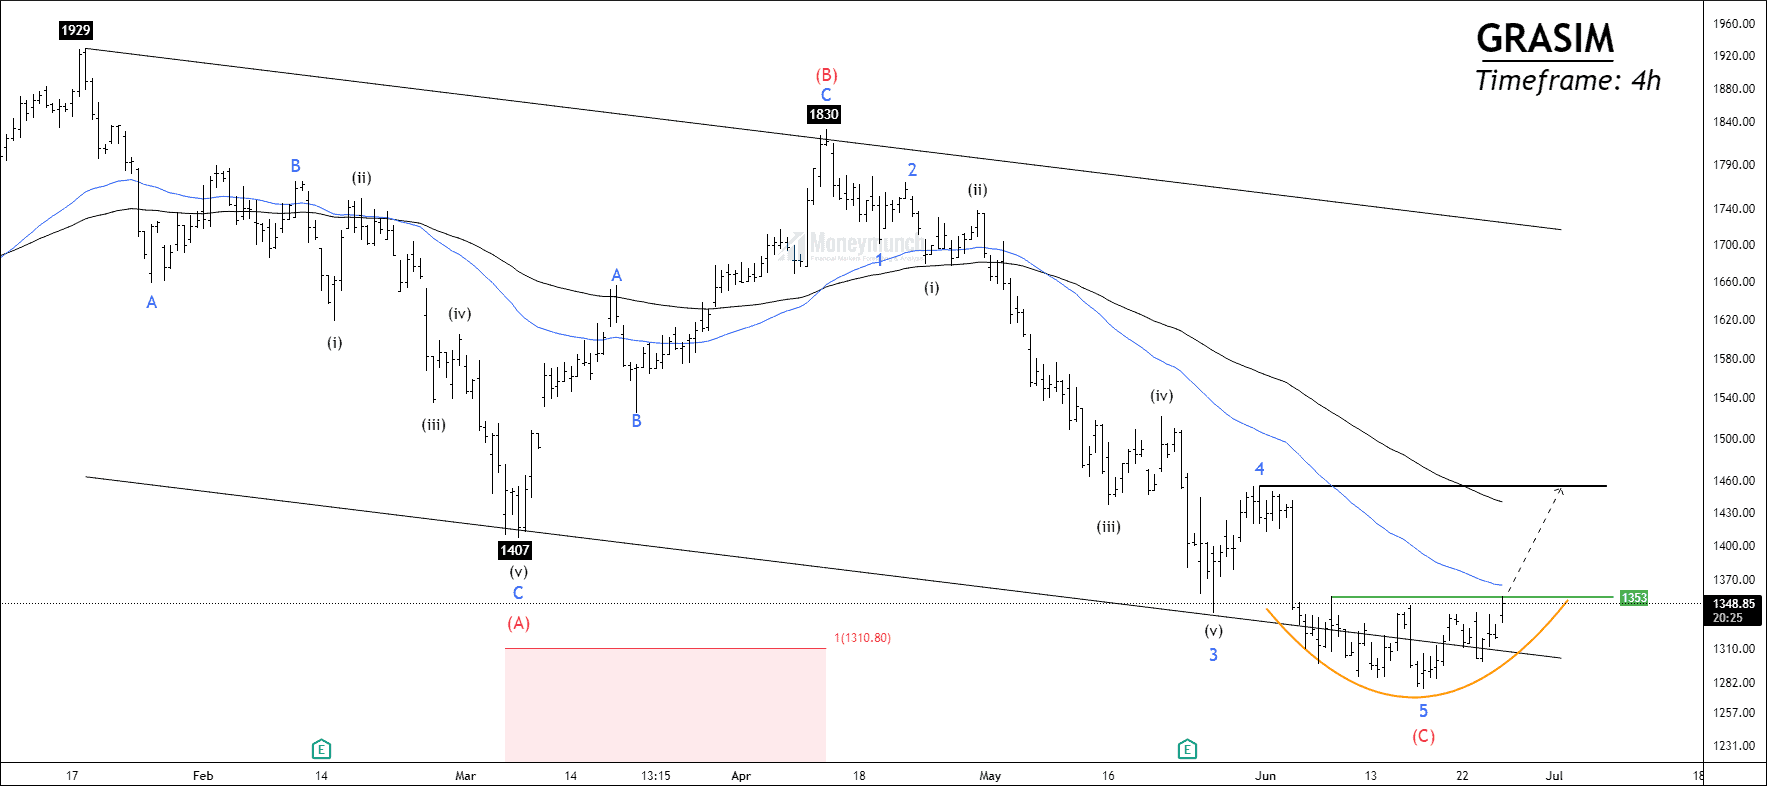
GRASIM has accomplished wave 5 of wave (c), and we may expect an upward move for the following targets: 1380 – 1420 – 1447. BUT, you should not buy this stock before reading this complete research report of GRASIM.
GRASIM has made a low of 1276 at wave C, and the price started forming a traditional cup and handle pattern. Wave C has reached 161% Fibonacci extension of wave A at 1276.
If the price breaks out at 1353, traders can trade for the following targets: 1380 – 1420 – 1447. Breakdown of the parallel channel will make this trade invalid.
According to wave theory, there is no way to change a trend until a lower-degree fourth wave breaks out. The price will be bullish if it breaks out of sub-wave 4 at 1456.
I will upload further information soon. To become a subscriber, subscribe to our free newsletter services. Our service is free for all.
Get free important share market ideas on stocks & nifty tips chart setups, analysis for the upcoming session, and more by joining the below link: Stock Tips
Have you any questions/feedback about this article? Please leave your queries in the comment box for answers.
Amazing work, Thank you for sharing.
Is it the right time to invest in the market?
Sir, I am following you for more than 5 months. your all charts are informative and accurate. Keep sharing your excellent work.
brilliant ✅✅
It’s super site, I was looking for something like this