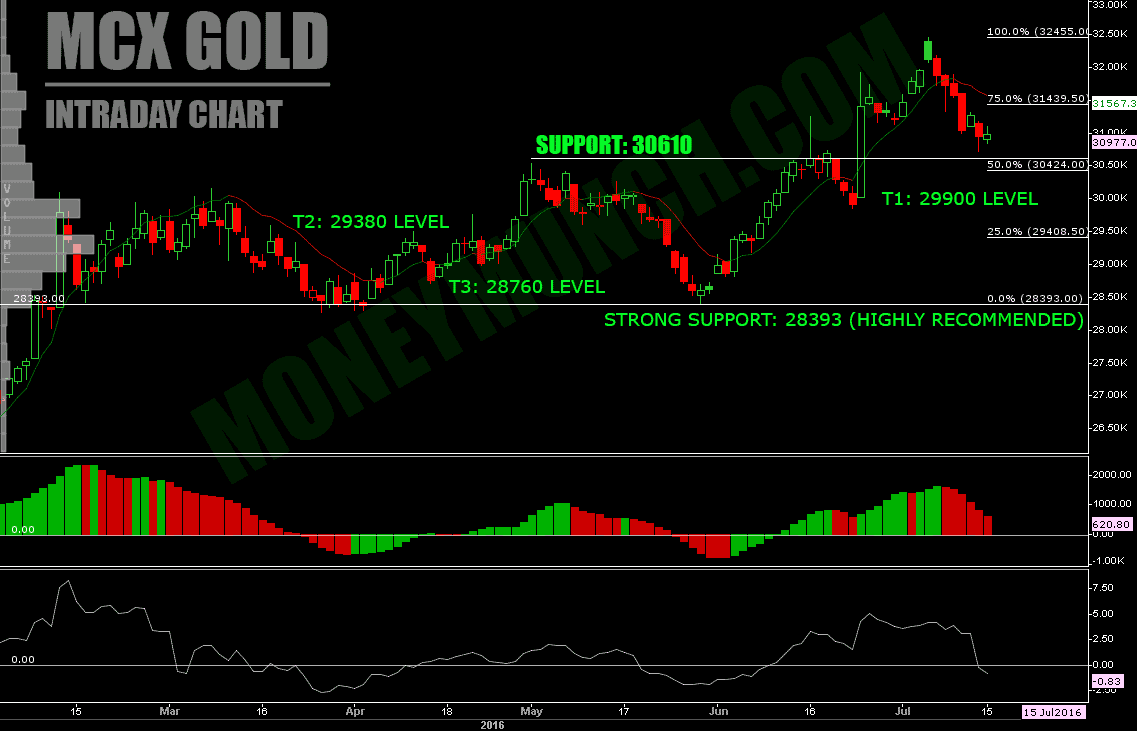
Look at above chart, MCX Gold moving around the support 30610 level. Gold will test, 30424 level soon. If it breaks the support and stay below to 50% level then it may fall down up to 29900 – 29380 – 28760 levels below.
Keep in mind, don’t sell until it break the support (gold trend will stay up until breakout) or take some expert advice before investing. To become a subscriber, subscribe to our free newsletter services. Our service is free for all.
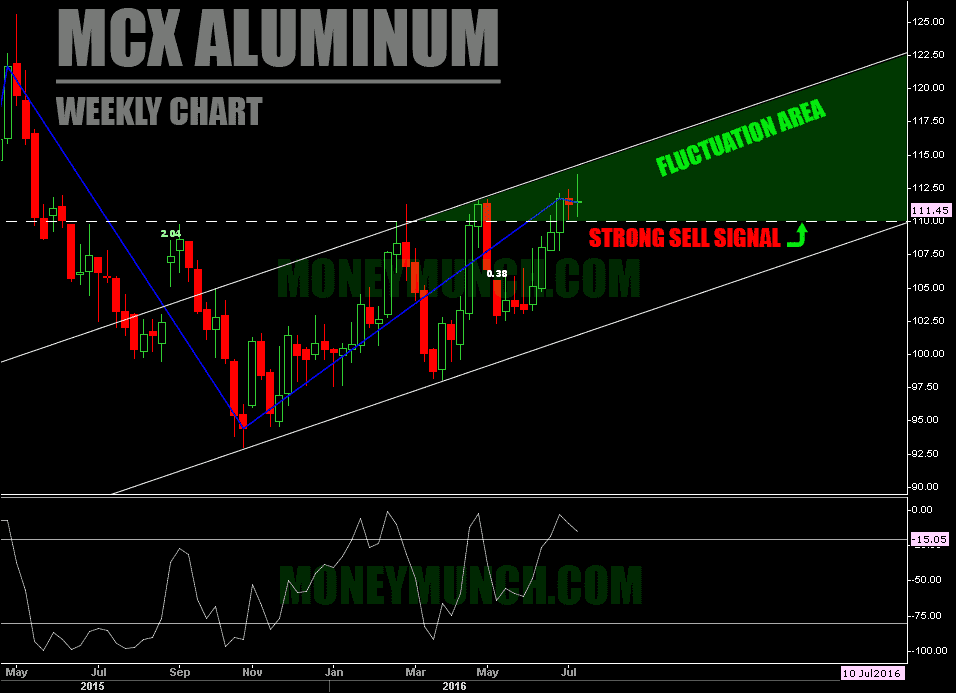
So many traders send us emails for any recommendation on MCX Aluminium. I would like to say, aluminum buyer’s future is not bright for long-term. Look at the below weekly chart of Aluminium:

Sellers will pull down aluminium if shows closing below the 110 level. Above 110 level, aluminium will stay positive, but last weekly candle indicating Monday opening bell is very important for buyers and sellers.
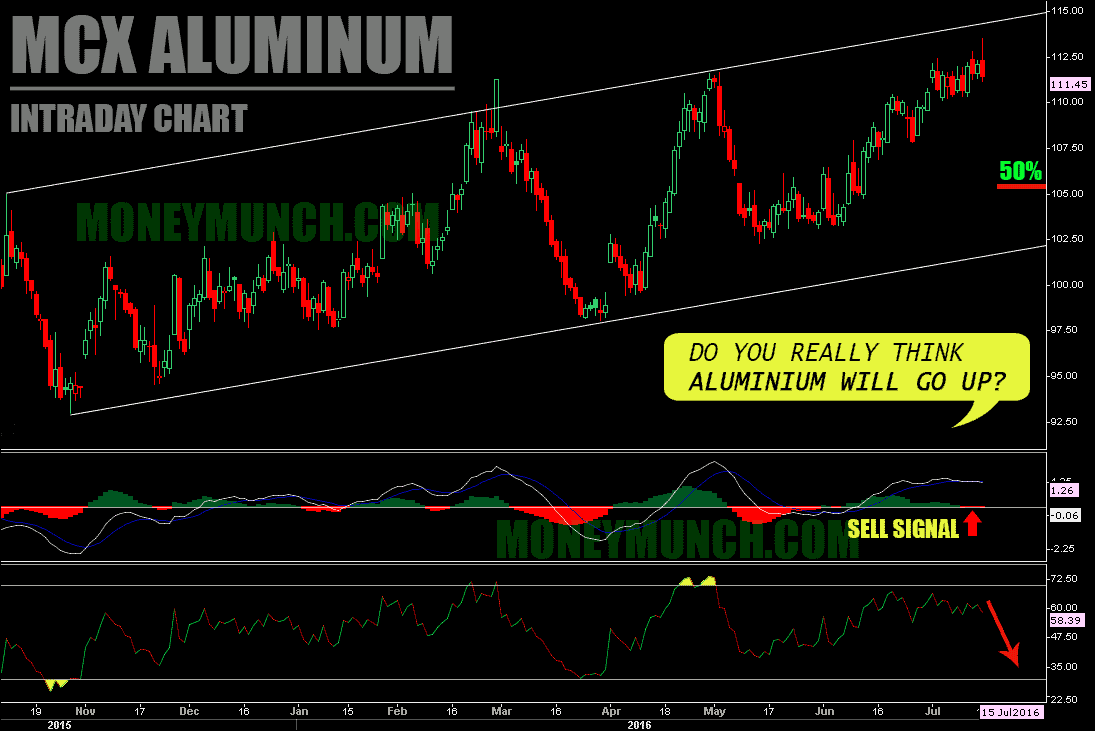
Lookout below intraday chart of Aluminium:

MACD and RSI throwing sell signals on daily chart but don’t take any risk until it break 110 level. If aluminium show closing below the weekly chart strong sell signal (110 level) then it will hit 105.5-103.3 levels soon.
This week important global economic events for commodity traders:
18 July
19.30: US Housing Market Index
20 July
14.00: UK Unemployment Rate
20.00: US Crude Oil Inventories (IMPORTANT)
22 July
05.20: JP Trade Balance (IMPORTANT)
07.30: JP Flash Manufacturing PMI
18.30: US House Price Index MoM
19 July
14.00: UK Core CPI y/y, PPI
18.00: US Building Permits, Housing Starts
21 July
13.00: German Flash Manufacturing PMI
13.30: EU Flash Manufacturing / Services PMI
18.00: US Unemployment Claims
20.00: US Natural Gas Storage (IMPORTANT)
Get free MCX ideas, chart setups, and analysis for the upcoming session: Commodity Tips →
Have you any questions/feedback about this article? Please leave your queries in the comment box for answers.
