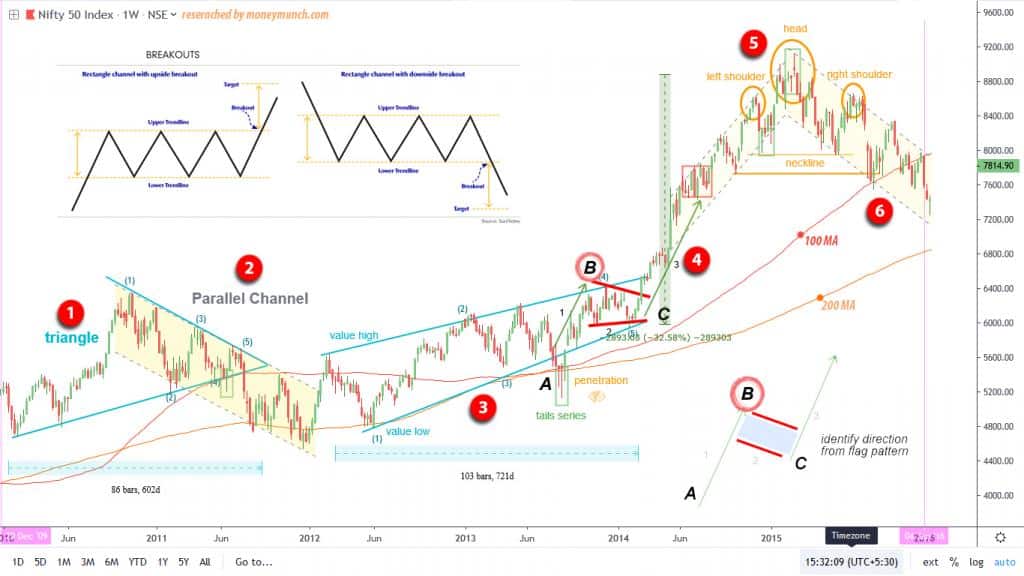

Chart the weekly data for the NIFTY for the 2010 through 2015 time period and was obtained following patterns;
- Triangle pattern
- Parallel Channel
- Breakdown strategy
- Flag pattern
- Head and Shoulders Pattern
- Downward channel
We can easily understand the uptrend, downtrend, or sideways trend during that time. These all pattern are repeating time to time. We can also identify them while trading. Short-term traders sometimes practice what is called event trading. This is when either a news announcement is due, a surprise news announcement occurs, or a holiday is soon to occur. Holidays are seasonal, We will update soon very deepest research for identify future developing patterns.
Charts reflect market behavior that is subject to certain repetitive patterns. Given sufficient experience, some traders will uncover an innate ability to use charts successfully as a method of anticipating price moves.
Some analysts are now using pattern-recognition systems and other sophisticated computerized methods, and early results have demonstrated that, indeed, many of the traditional chart patterns have some predictive value. Charts have other uses, however, if only to quickly observe the history of prices. The benefits of chart use outweigh the problems associated with their interpretation.
To become a subscriber, subscribe to our free newsletter services. Our service is free for all.
Get free important share market ideas on stocks & nifty tips chart setups, analysis for the upcoming session, and more by joining the below link: Stock Tips
Have you any questions/feedback about this article? Please leave your queries in the comment box for answers.