ABBOTINDIA: Impending Decline
Timeframe: Daily
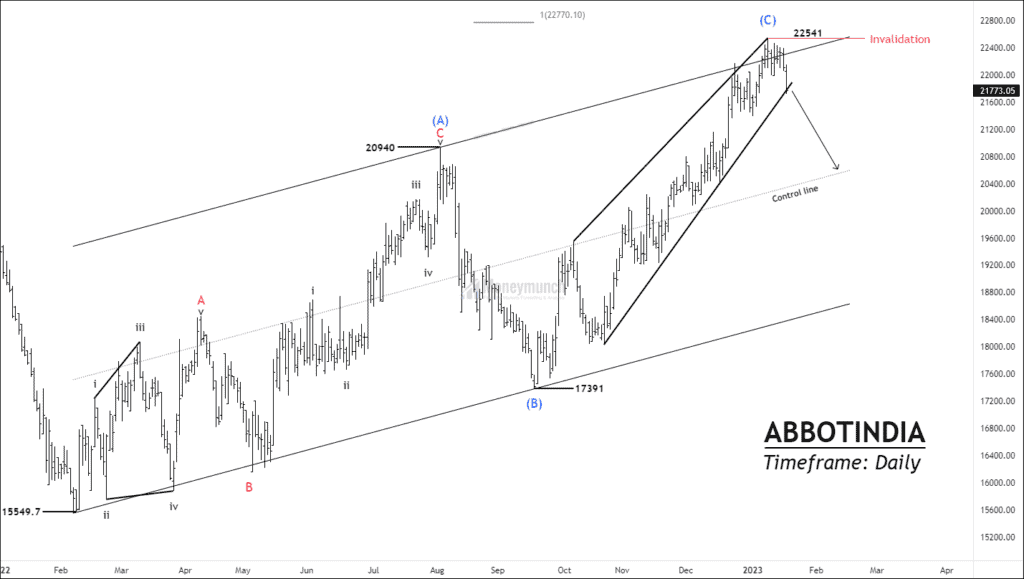
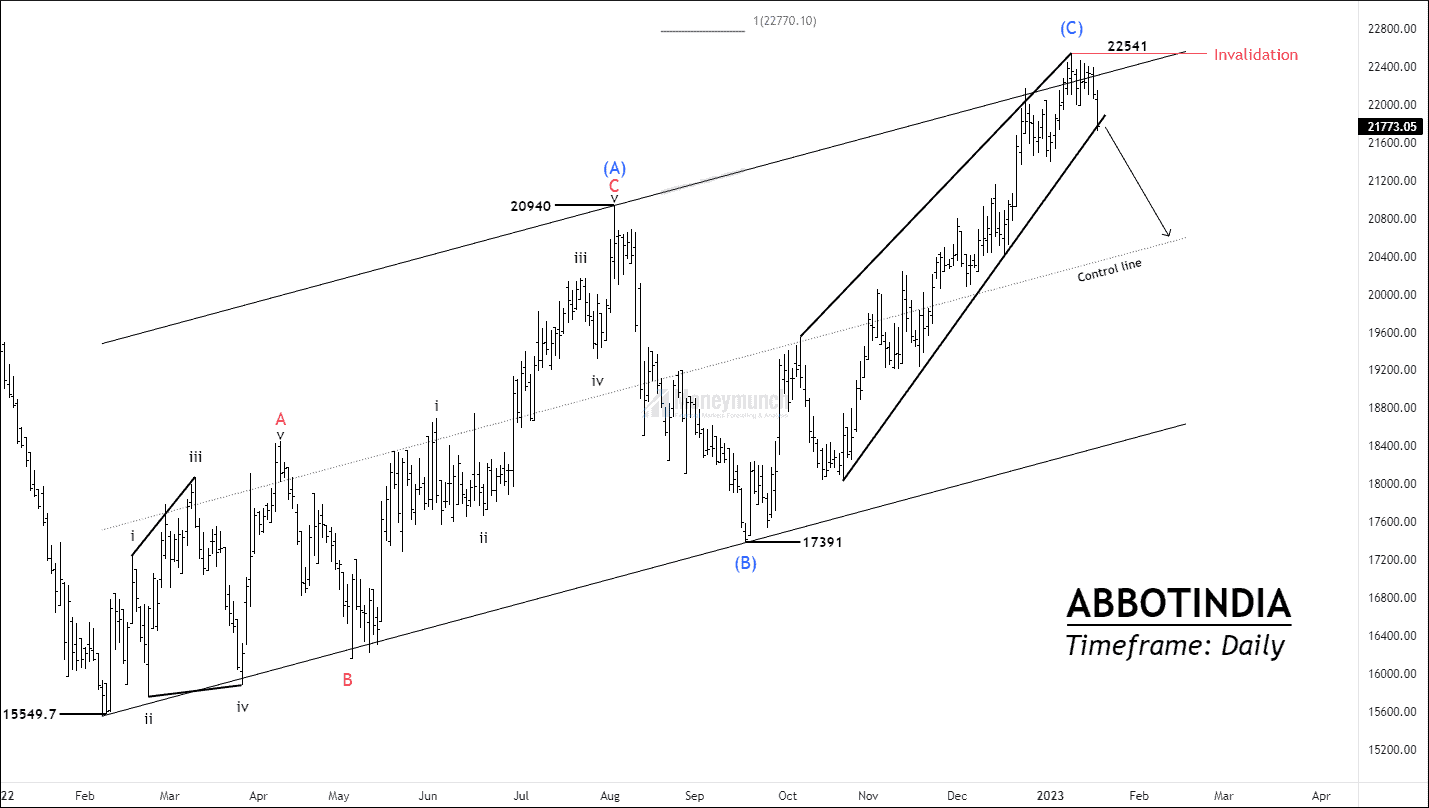
NSE ABBOTINDIA has accomplished impulsive wave C of the corrective cycle and started collapsing for the new wave cycle. Wave (C) traveled 100% distance of wave (A). Hence, wave (A) = Wave (C).
Price started falling After the completion of wave (C) at the upper band of the parallel channel. If the price breakdown the diagonal, Traders can set their target at the control line.
NSE BALAMINES – Bearish continuation
A daily timeframe chart of NSE BALAMINES shows weakness. Prices are trading below swing lows, signaling a bearish continuation. There is a bearish trend in volume in NSE BALAMINES.
If the price sustains below 2525, traders can sell for the following targets: 2499 – 2472 – 2456.
NSE HINDUNILVR – Short-Term Bullish Setup
HINDUNILVR has broken out 20/50/100 EMA with huge volume and a big real-body candle. The pullback can increase the potential of the trade, which will help traders to manage their risks.
If the price sustains above 2635, traders can trade for the following targets: 2666 – 2698 – 2716.
NSE ICICIPRULI Is Preparing for Skyrocket But…
NSE ICICIPRULI has reversed after making a low of 437.7. Prices are trading above 20/50/100 EMA expect 200. The security reversed with good volume near a significantly lower low of 430.
Bulls are pushing the market upward as prices could not make a new low. If the price sustains above 475, traders can buy for the following targets: 486 – 500 – 516.
Get free important share market ideas on stocks & nifty tips chart setups, analysis for the upcoming session, and more by joining the below link: Stock Tips
Have you any questions/feedback about this article? Please leave your queries in the comment box for answers.


 Lock
Lock
Good insights. Thank you for sharing. These trades were profitable.
Appreciate your hard work! Guide me for premium services.