KPRMILL – Elliott Wave Projection

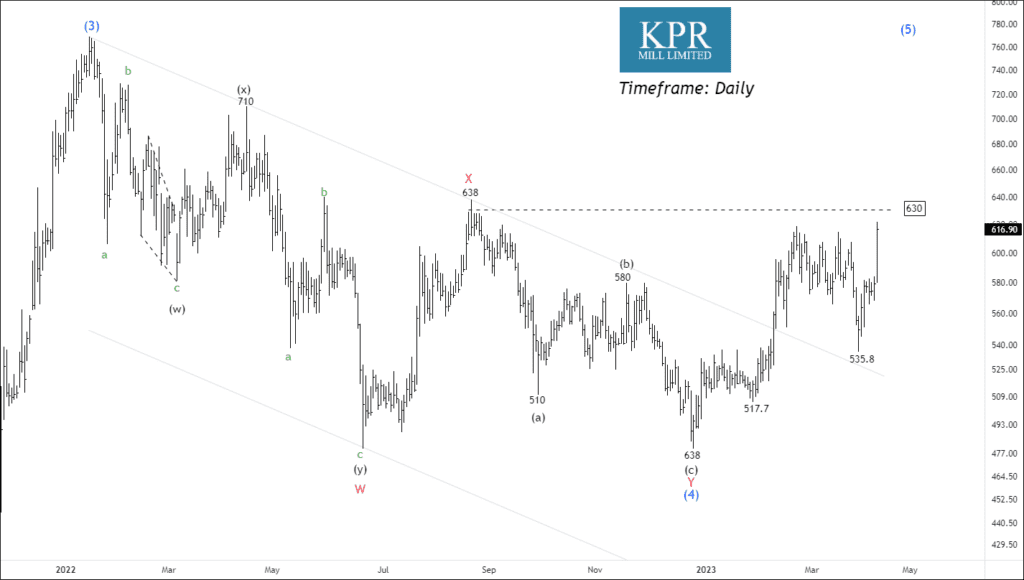
Timeframe: Daily
NSE KPRMINES is a security that has been undergoing a corrective phase for over 98 weeks. However, the security has shown indications of a bullish reversal as it formed a double-bottom pattern and reversed its price action in favor of the bulls.
Moreover, the security’s current price is trading above the 200-day Exponential Moving Average (EMA). The 200-day EMA helps identify the long-term trend of security. The fact that NSE KPRMINES is trading above its 200-day EMA indicates that there is strong bullish momentum in the security, and it may continue to rise.
The correction formation of wave (4) in NSE KPRMINES has completed a double three pattern, with the final wave (c) of wave (y) of wave 4 ending at 479.9. Traders Can consider buying the security if the price remains above wave X at 630, with target prices 673 – 749 – 799+. Traders must also be cautious and reassess their strategy if the price falls below wave X, as this setup would become invalid.
We will update further information soon.
NSE TATASTEEL – Breakout Setup
NSE TATA Steel is currently exhibiting a strong uptrend on the daily time frame. The security’s price has found support at 101 and risen sharply, indicating bullish momentum. Additionally, both the Relative Strength Index (RSI) and Average True Range (ATR) are rising, indicating a potentially profitable opportunity for intraday traders.
Furthermore, the security has broken through its resistance line, which is a bullish indication for traders. If the price remains above 106, traders may consider buying the security for the following target prices: 107 – 109 – 111 – 115+.
Get free important share market ideas on stocks & nifty tips chart setups, analysis for the upcoming session, and more by joining the below link: Stock Tips
Have you any questions/feedback about this article? Please leave your queries in the comment box for answers.
Excellent job!