Timeframe: 4h
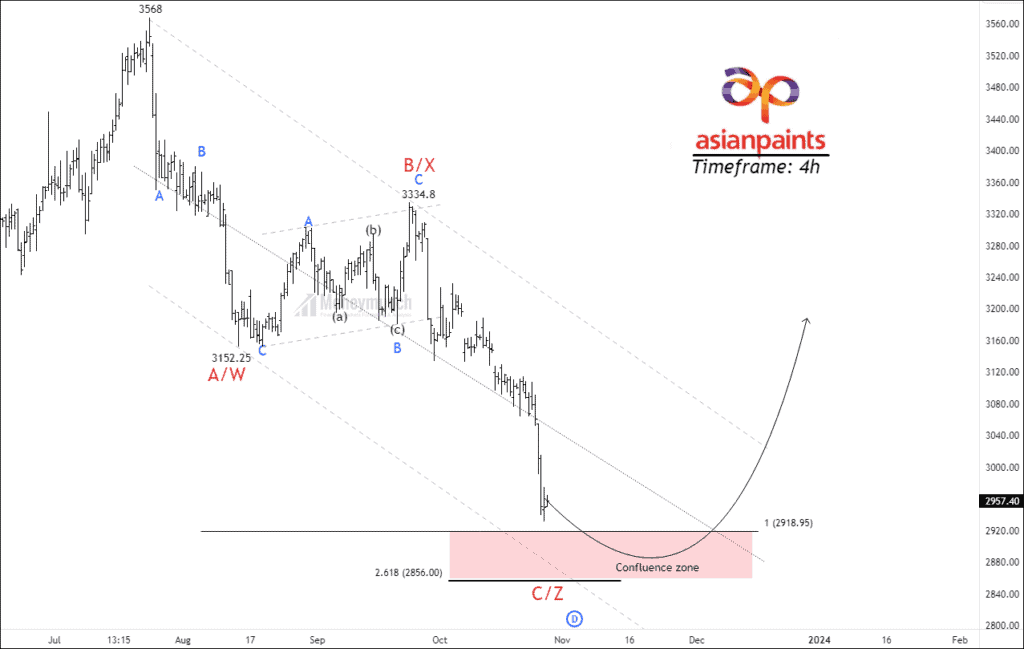
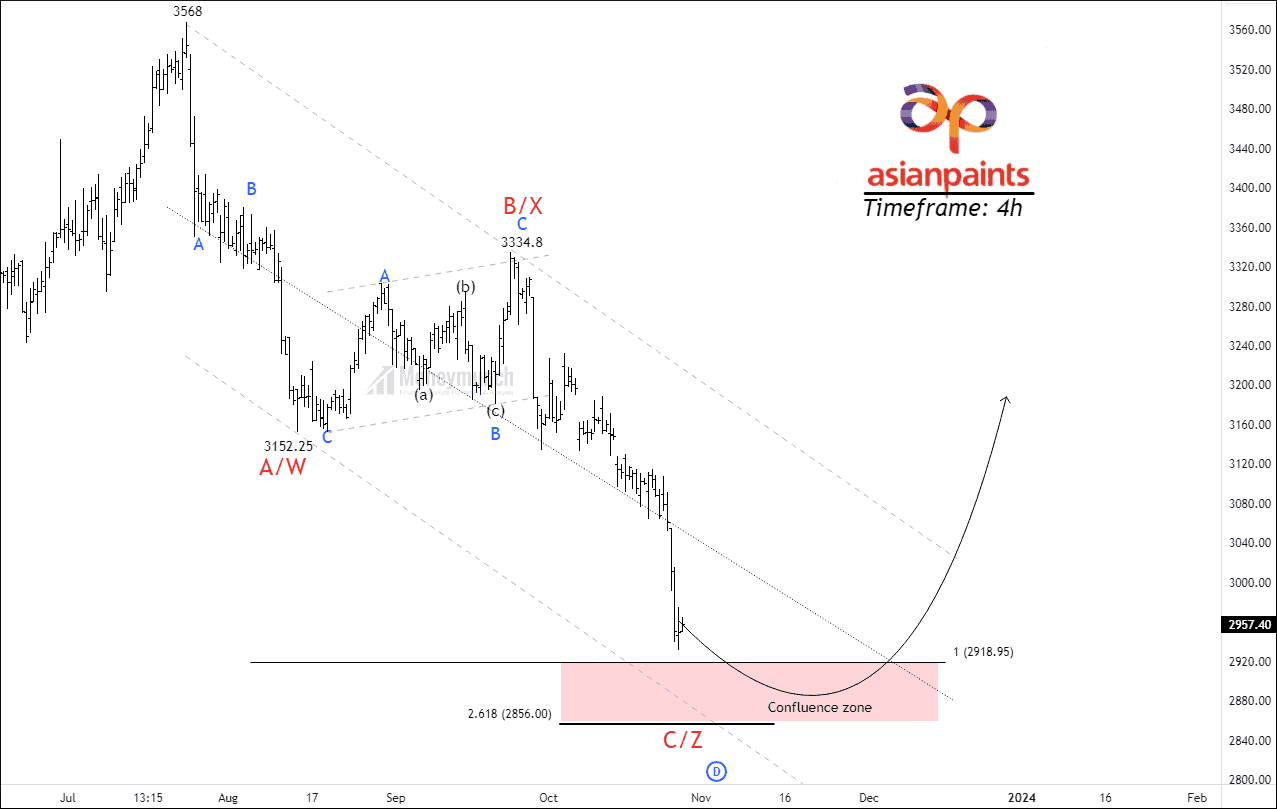
After making a high of 3568, NSE Asian paints have formed a corrective structure. This structure could be W-X-Y or A-B-C. No matter which label you choose, the picture showcases the same story.
At present, Asian paint is forming sub-wave C of final impulse C of the correction structure. The total retracement of the whole correction is 78.6%. Wave C extended 100% at 2916 of wave A, Hence wave C=wave A. It could be the termination point of wave C. Reverse Fibonacci of wave B shows that the move ends at 2.618% at 2856. Traders have a confluence zone of wave 2916-2856.
Traders can trade with the following targets: 3005 – 3076 – 3127+. Note that the targets can extend after the break out of the channel up to X. Invalidation will play a crucial role in this bottom fishing setup.
Premium subscribers will get trade setup with entry, exit, and invalidation levels.
NSE SONATASOFTW – Breakout Setup
NSE SONATSOFTW has broken its all-time high of 1150. The RSI of the price has risen to 67.52, where the ATR of the price is 42. The price has broken out 20/50/100/200 exponential moving average.
The security is constructing the final wave (5) of the wolf wave pattern. If the price sustains above 1155, traders can trade for the following targets: 1190 – 1230 – 1246+. Free subscribers can take the previous day’s low as an invalidation level.
Premium subscribers will get trade setup in our mobile application at the exact time.
 Unlock This Article
NSE GREENLAM Is Ready for Skyroket
NSE GREENLAM has broken out an A-B-C corrective structure. Price is trading above 200/100 EMA and on the 20/50 EMA. The RSI of the price rose to 58.49.
Stock trading works best with a fundamental catalog which is the positive results. Breakout of the A-B-C correction can be profitable for traders. If the price breaks out 422, traders can trade for the following targets: 437 – 458 – 473+. Free subscribers can take the previous day’s low as an invalidation level.
Only premium subscribers will have further information soon.
NSE DRREDDY – Weakness Ahead
DRREDDY is looking weak on the daily time frame chart. Price is forming the final wave (5) of the wolf wave. The security has an RSI of 40.73, and the price is trading at 100 EMA.
The stock has retraced 38% of the previous impulse. The price target should not be more than 1.618% of the reverse Fibonacci retracement of wave (4) at 5218. If the price breaks a support level of 5399, traders can sell for the following targets: 5360 – 5290 – 5237+.
Further information is available for premium subscribers only.
NSE BEL – Future Setup For Premium Subscribers
NSE AXISBANK- Bullish Structure
Get free important share market ideas on stocks & nifty tips chart setups, analysis for the upcoming session, and more by joining the below link: Stock Tips
Have you any questions/feedback about this article? Please leave your queries in the comment box for answers.
Great chart!
Request you to analysis nifty
I agree with your analysis. It’s fantastic……
😲😲😲😲
Hello,
I am interested in your paid service as well as Elliott wave book.