Looking for accurate and timely trading signals, forecasts, technical analysis, fundamental research reports, and daily or weekly charts on global indices? Look no further than our World Indices category. Stay on top of market movements and make informed trading decisions with our comprehensive analysis and insights.
Did you remember what I had written on last Monday about EURUSD in my last Global currency update Click here to read our last newsletter. I had written “We expect here drift down to 1.3570 – 1.3556 – 1.3500 and more.” Euro vs. US Dollar kissed my 2nd target kissed at 1.3556. Our subscribers booked full profit on 1.3540 and they know it.
About GBPJPY I had told you “have to keep eyes on 168.50 level rise above it is bullish again.” It breaks the resistance and kissed high 169.13.
What about EURCAD, CADJPY & AUDUSD and more Currency which I update for our members . Well, my all Members know very well.
To become a subscriber, subscribe to our free newsletter services. Our service is free for all.
Note: I also had written about USDJPY in my last newsletter Resistance 101.59 cross of these level, and we see some more bullish trend to 101.96 – 102.48 – 103.00. My final target was kissed at 103.00 in last trading session.
As I said in last update, all targets are kissed… To read full update, click here.. And just try to remember what I said? I updated about 3 Forex Currency pairs EURUSD, GBPUSD, AUDUSD In GBPUSD I said “Sell with no fear with the targets 1.6100 – 1.6075“ And about AUDUSD “Break of support (0.9411) and we must see bloodbath to 0.9393 and more.“ On AUDUSD our subscribers booked full profit on 0.9292. AndEURUSD subscribers knows everything about it, there’s no need for clarifications.
Trading Strategy for Monday market?
It seems bullish trend should end with resistance 1.3575 then,
we are able to see some free fall to 1.3520 – 1.3506 – 1.3485 – +.
But brake of resistance, and we must see shortly 1.3581 to 1.3613 levels.
Resistance 101.59 cross of these level, and we see some more bullish trend to 101.96 – 102.48 – 103.00. But,
what happens if move backwards after the resistance and levels are for our members only by mail with exact time & level.
To become a subscriber, subscribe to our free newsletter services. Our service is free for all.
” EURJPY & AUDUSD we’ll update later for subscribers only on yahoo messenger “
(future) Last close @ 62.95, looking forward here in Rupee against the Dollar after the RBI’s obstruction on Friday’s trading session helps the INR to close on strong.Cross the hurdle, and we see 63.19 – 63.45 for short term and 63.55 – 64.50 and more but keep your eyes on hurdle…
what will happen if unable to break the hurdle?
Well, I’m not going to tell you everything here. more updates about USDINR for subscribers only.
GBPINR and JPYINR Only Forex service member know thought use of your username & password
Unlock This Article
Only subscribers can read the full article. Please login to read the entire article.
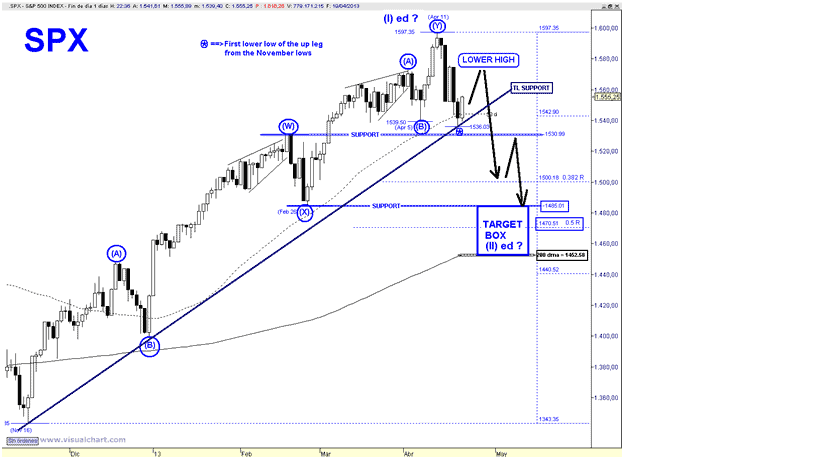
In my opinion the top of the up leg from the November lows is in place.We will have the absolute confirmation when price establishes a lower high.Below I show you the SPX weekly momentum indicators, where we can see that the RSI has breached the trend line support in force since the November 16 low.The next intermediate buy signal usually should occur when the RSI and the Stochastic retest the 50 line.
I rule out a major reversal, instead I maintain the scenario of a retracement of the advance from the November lows.As I discussed last Friday the major reasons that suggest that price has not established a major top are:
The up leg from the November lows has unfolded a corrective 7-wave structure ===> A corrective EWP cannot establish a major Top.
The current pullback is also unfolding a corrective pattern, ===> The intermediate trend remains up.
Retails investors are extremely bearish (I have never seen a major top with an extremely low AAII Bull ratio)
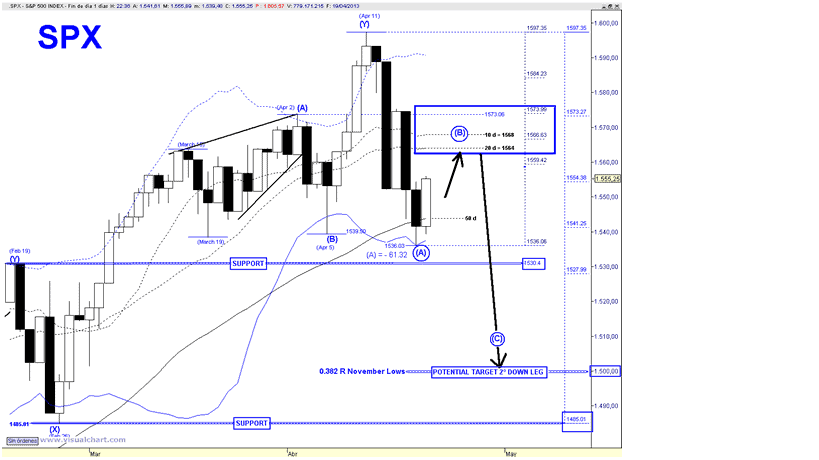
Regarding the potential target, at the moment, since we are in the initial stage of a corrective pattern I can only say that price should establish a bottom in the range 1485 – 200 DMA. (which today stands at 1453)Once a lower high is in place, the next down leg should aim at the 0.382 R = 1500, where probably a large rebound will take place. If bears maintain the sequence of lower high/lows then the following down leg will reach the target box.
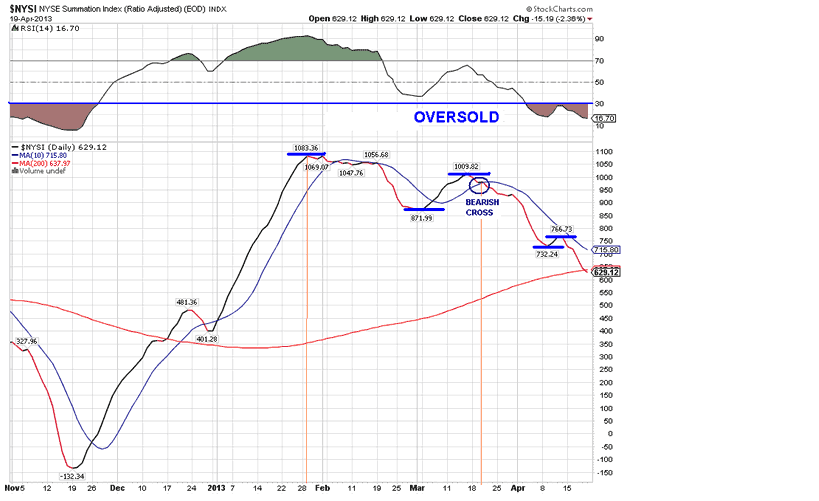
Therefore, I reiterate that the above “road map” looks very probable as long as the bounce, which began last Friday, establishes a lower high.Regarding the long-term count, I maintain the Triple ZigZag wave (X) scenario. As I have discussed in previous weekly updates since the assumed wave (Z), which began at the November 2012 low is not impulsive I am suggesting that it should unfold an Ending Diagonal, if this is the case on April 11 price has completed the wave (I). The summation Index, which, peaked at the end of January is already oversold (RSI has crossed the 30 line) and on Friday it has breached the 200 dma. It is remarkable that SPX has been able to establish higher highs with such a weak breadth performance.Going forward since price has just begun a corrective phase, an already oversold Summation Index should prevent a major decline.
Lets move on to the current price action.It is reasonable to expect that the rebound from last Thursday LOD to reach the target box delimited between the 20 DMA = 1564 and the 0,618 retracements = 1574.If it tops at the 20 DMA the 1×1 extension target for the following down leg would take us to the 0.382 retracement of the advance from the November lows at 1500.EW wise price would be unfolding a ZigZag therefore if lower prices were in the cards probably this initial ZigZag would morph into a Double ZigZag
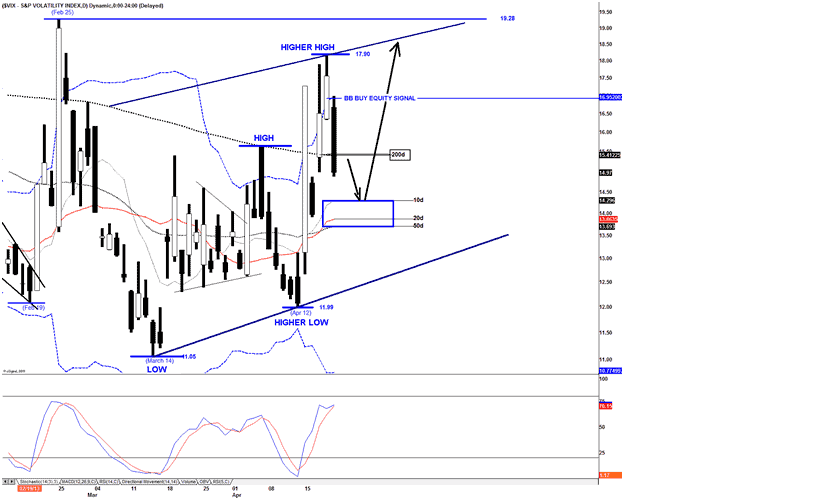
Lastly, VIX on Friday has “issued a Bollinger Band buy equity signal”. Friday’s drop has been larger than I initially thought, moving back below the 200 DMA. I still expect a bottom in the range of the moving averages (10-20-50) or in the worst-case scenario at the rising trend line support in force since the March 14 low. The lower is the retracement, the larger will be the assumed SPX wave (B) rebound.I still think that the pattern that VIX is unfolding does not suggest a major move to the upside, but as long as the sequence of higher lows/highs is maintained the trend remains up.To become a subscriber, subscribe to our free newsletter services. Our service is free for all.
My road map can be seen in the SPX daily chart below:
The main themes are:
The rally from the November lows has unfolded a corrective pattern = Triple ZigZag ===> Therefore we don’t have yet the top of the wave (X) from the 2009 lows.
Neither we do have yet the absolute confirmation that price has begun a corrective phase until bears achieve to break through the support layer located in the range 1538-1531
Once the support layer 1538-1531 is breached, I expect that this pullback will find a bottom in the range 1485-1431
Before moving on with the weekly technical update I have to bring forward the following technical issues that will affect the progress of the expected pullback:
The internal structure of the current downside price action is clearly corrective therefore every single impulsive sequence to the downside (waves C) can be the candidate to establish the end of the correction or at least it will open the door to large counter trend rebounds.
Bears also have an issue with an already oversold McClellan oscillator and with a bullish cross of its stochastic. Therefore, even if next week bears win the battle (achieving a lower high followed by a new lower low ===> My preferred scenario) the next dip of the McClellan Oscillator below the Bollinger Band will most likely trigger an oversold large counter trend rebound. (As long as the McClellan Oscillator remains below the zero line bears will remain in charge)
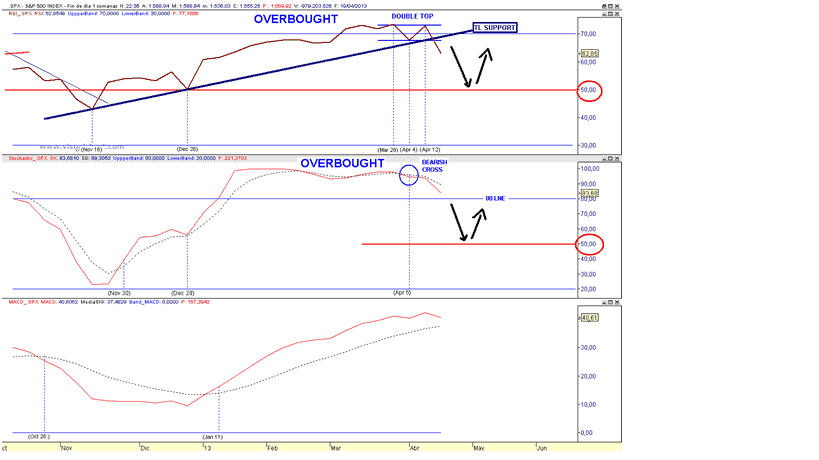
Weekly Momentum Indicators have to confirm the kick-off of the expected pullback:
The RSI has to break the trend line support in force since the November lows.
The Stochastic has to trigger a bearish cross followed by a drop at least at the 80 line.
The MACD will dictate over the intensity of the expected pullback depending upon if it issue a bearish cross.
Lets move on to analyze the SPX charts.
Friday’s reaction to a poor NFP (Investors are judging that bad economic numbers will maintain Quantitative Easing into infinity) has left in the chart a bullish Hammer which is suggesting follow through to the upside at least for next Monday.
I don’t know how long the bounce will last (Attempt of the bulls to kill the bearish set up). If it is chop up and down (But below 1564) during next week then price could be forming the right shoulder of a H&S that has a target at 1505, otherwise if it is just 1-2 days rebound what really matters is a lower high.
If the bearish set up pans out, remember the oversold McClellan Oscillator, if the assumed pending down leg is impulsive it could stop either at the 0.618 retracement (1519) or at 1505 (If the H&S pans out) from where I expect a large bulls’ countertrend attack.
Regarding the short-term price action, in my opinion, SPX from last week top has unfolded a Double ZigZag wave (A) therefore the initial pattern of the expected larger correction should be a ZigZag down.
The expected wave (B) rebound in progress can also unfold a ZigZag since I doubt that at Friday’s hod the counter trend bounce has topped, hence the potential target should be located in the 1561 +/- area. Bulls will probably try to form an inverted H&S with the neckline at 1561.78 (Eventually it should result in a bull’s trap).
Nasdaq: Going forward this the third stock index that I will closely monitor.
Why?
Because the 200 DMA is standing above the February 26 reaction low, ONLY 2% below Friday’s EOD print, which should be the right spot for the kick-off of a large countertrend fight from the bulls (bottom or temporary halt of a larger corrective pattern). If eventually the 200 DMA is breached, it will issue a sell signal to the majority of institutional investors.
If the 200 DMA is breached then maybe the large Triangle wave (B) option could pan out:


 (future)
 Unlock This Article
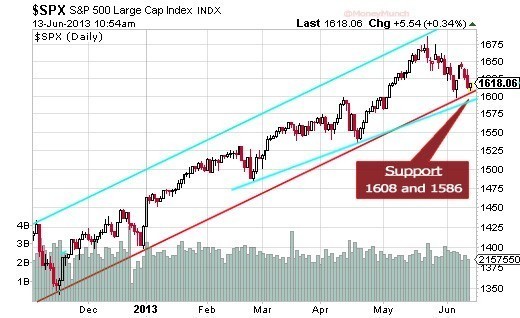
 I MAINTAIN UNCHANGED THE CALL OF A TEMPORARY TOP