Chart Pattern Analysis:
1) Bullish Cup & Handle Pattern:
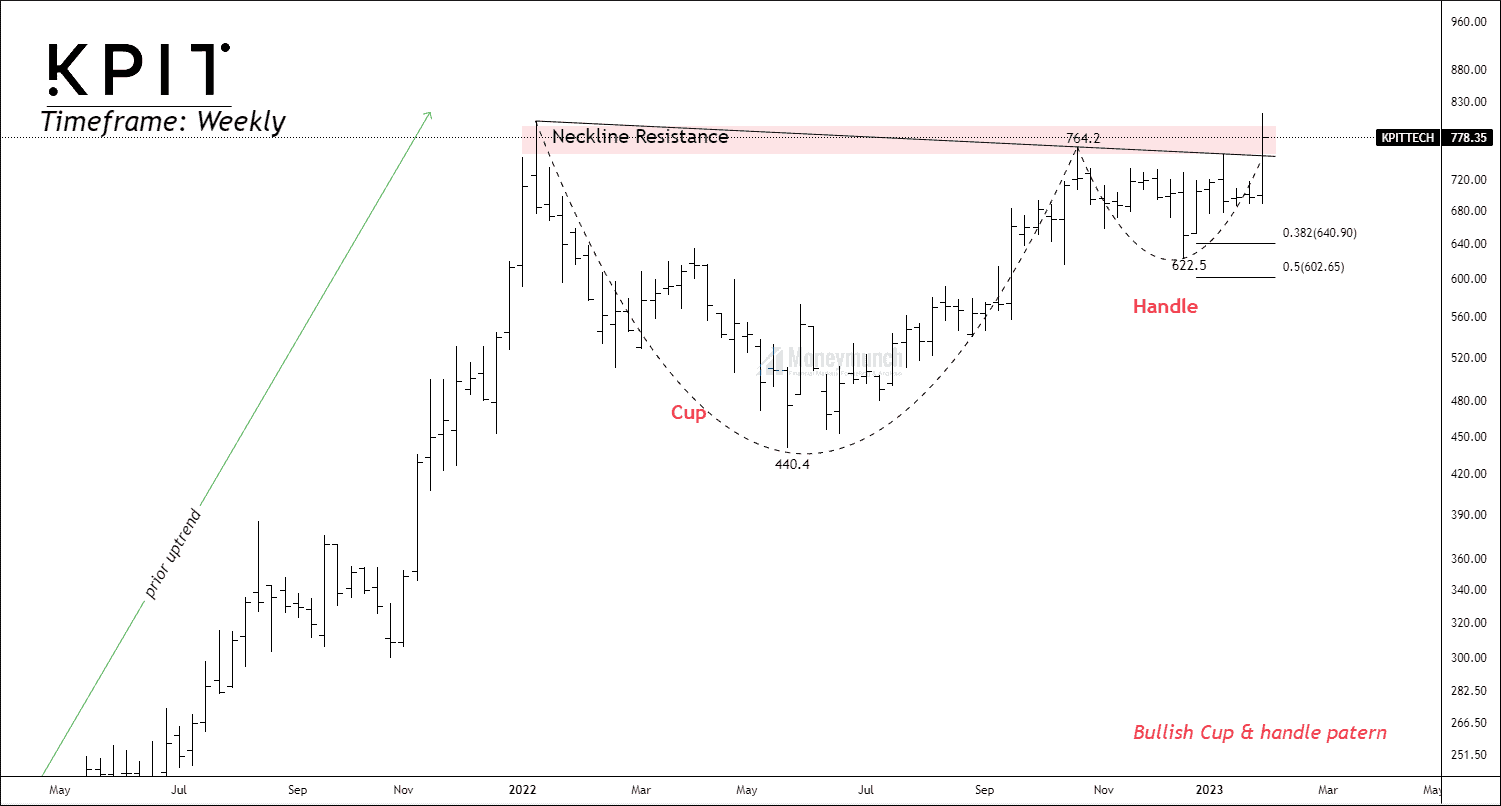
Timeframe: Weekly
The cup and handle pattern is a bullish continuation pattern. To validate this pattern, traders should look at the following checklist:
- Prior trend: As it is a continuation pattern, the price should have a prior bullish trend.
- Length & Depth: Normally, a “U” shape longer cup provides a more accurate bottom than a “V” shaped cup. Price has formed 41-week-old cup, which is not too deep. The cup should not retrace more than 61.8% of the depth of the last swing. The general depth of the cup is 50% of the previous move.
- Handle: We should not trade deep handles. It suggests weak demand pressure. The handle should not retrace more than 1/3 or 50% of the cup. In this security, the price retraced 50% of the cup.
- Volume: Volume decreases during the decline and surges after the breakout.
- Breakout, target, and stop-loss: Breakout will confirm when the price will break out the neckline resistance with good volume only. The target of a trade can be determined by the cup’s depth. There are two stop-loss points: (i) low of handle (ii) middle point of the handle
- Failure: Failure will result in a double top reversal pattern.
2) Consolidation Box/Value Area:
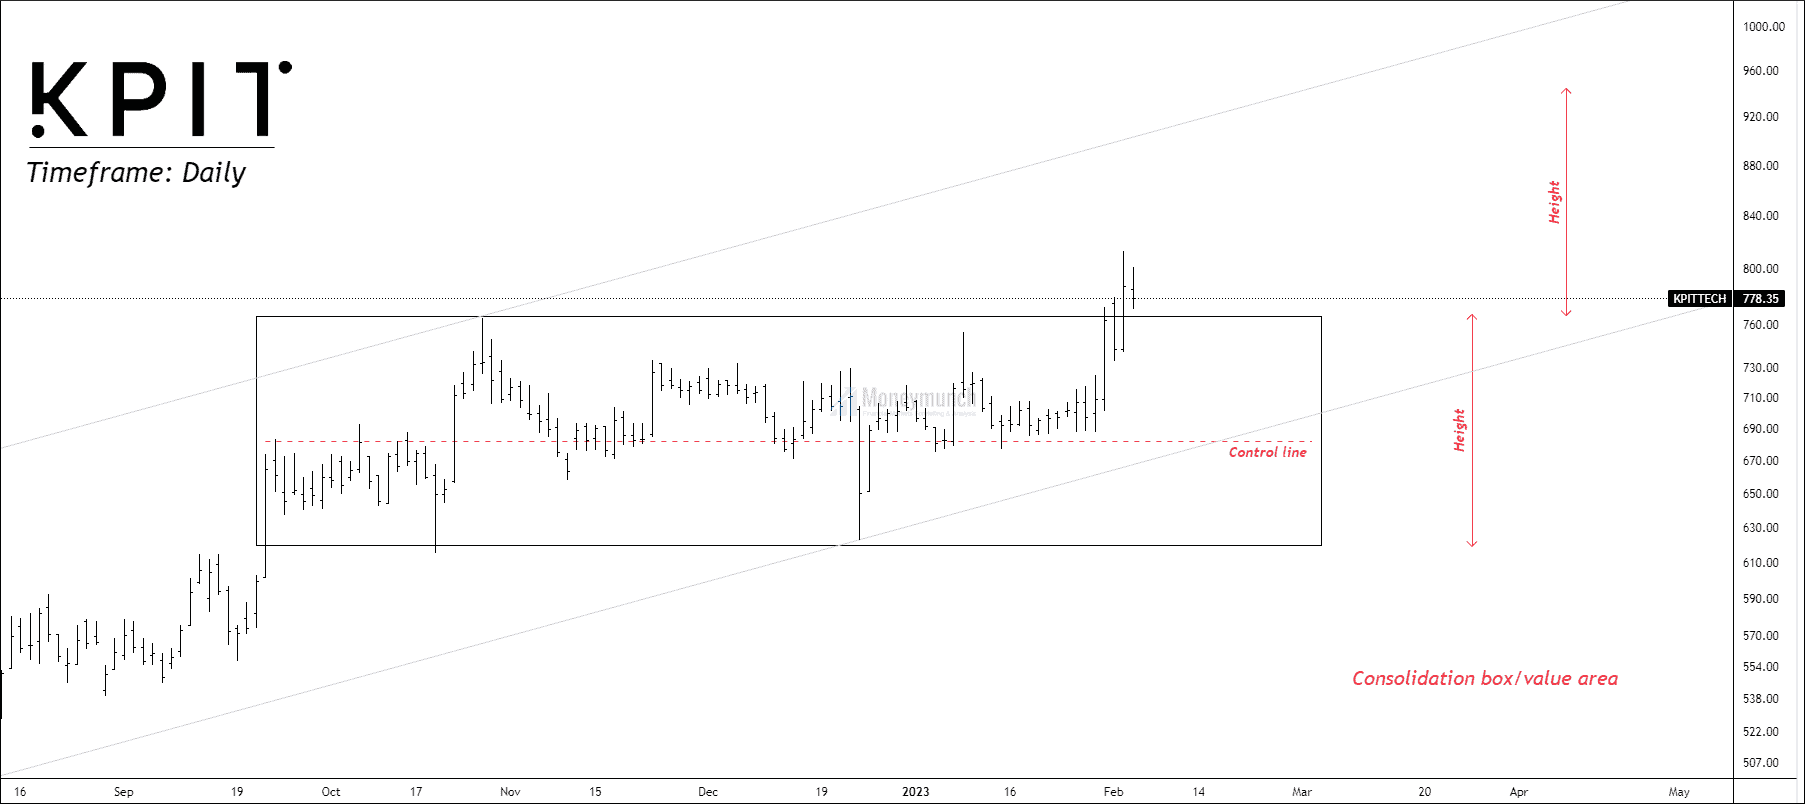
Timeframe: Daily
NSE KPITTECH has found a consolidation box on the daily timeframe chart. Price took support from the control line as moving toward the upper band of the channel. The upper line indicates resistance, so a resistance breakout increases demand pressure. After retracement, if the price sustains above the upper band of the channel, traders can set their targets up to 940. It’s better to trade after a pullback because the price may face resistance near an all-time high.
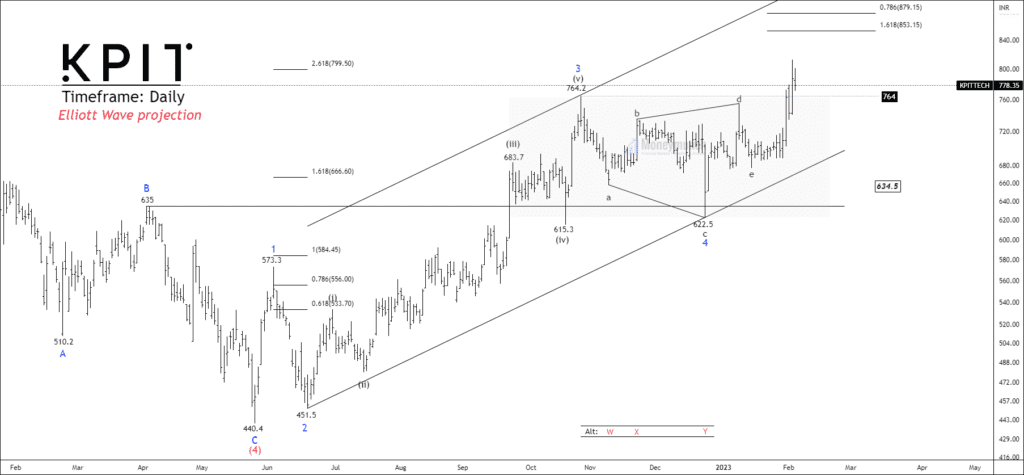
Elliott Wave Analysis:
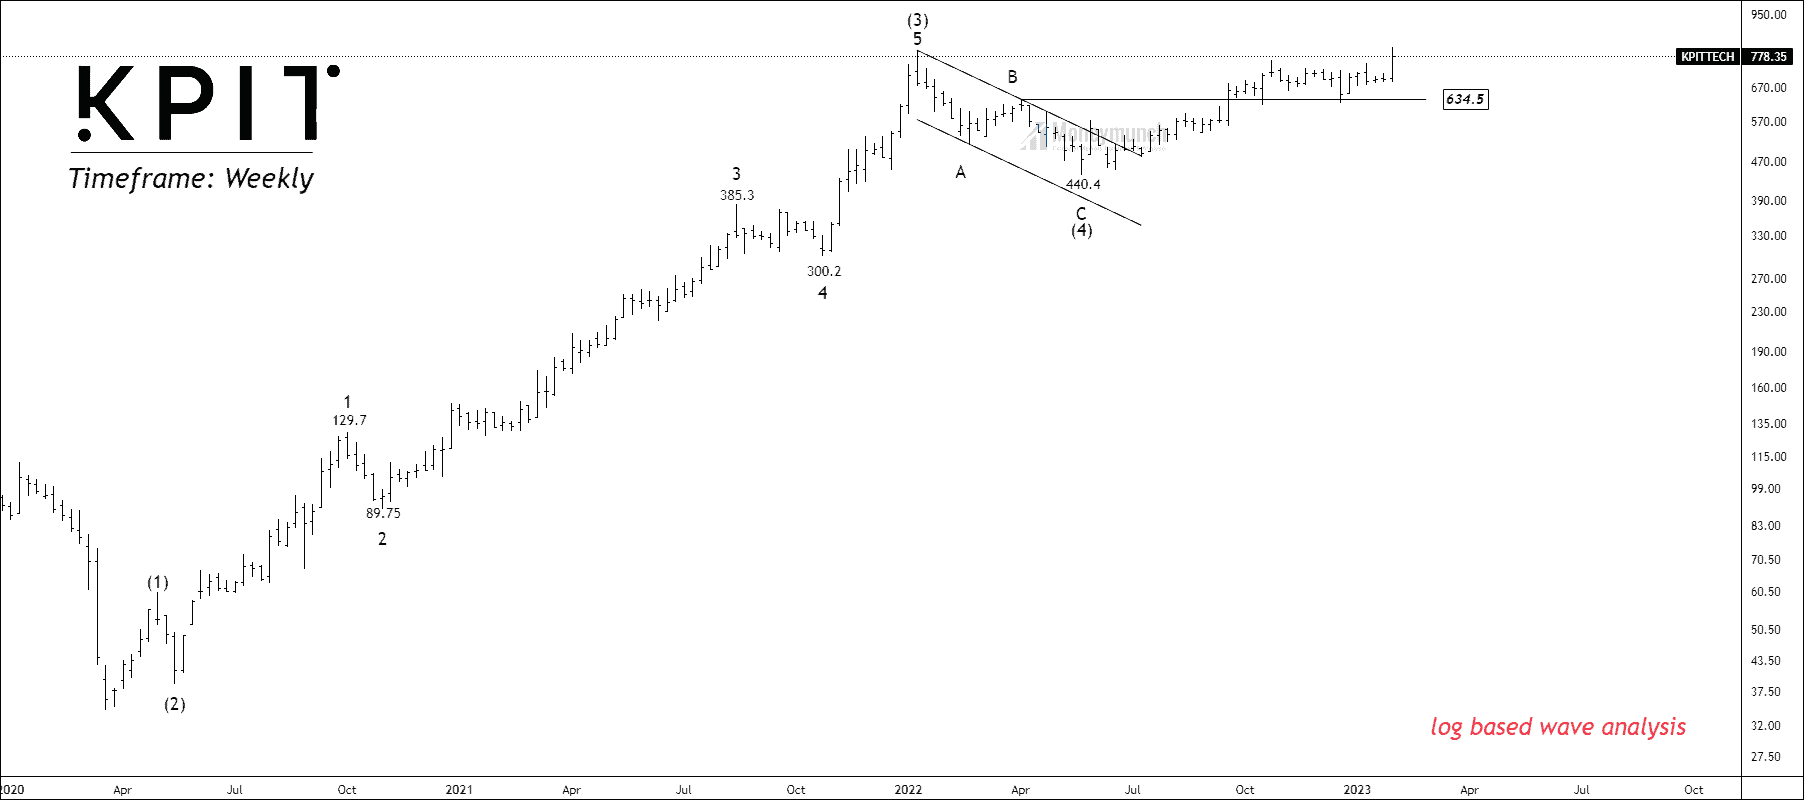
Timeframe: Weekly
Overview:
KPITTECH has accomplished the corrective wave (4) and formed the final impulsive wave (5). As you can see, the stock is trading near the high of the impulsive wave (5) at 801.
Security can face crucial support of wave B at 634. The trend is bullish, but the strength is not as muscular as wave (3). However, we can still trade wave (5) by analyzing a smaller timeframe.
Rule check:
1. Wave (3) is not the shortest wave among 1, 3 & 5.
2. Wave (2) is not retraced more than 99% of wave C.
3. Waves (4) and (2) show alternation in price, time & pattern.
4. Wave (4) isn’t entered into the price territory of wave (2).
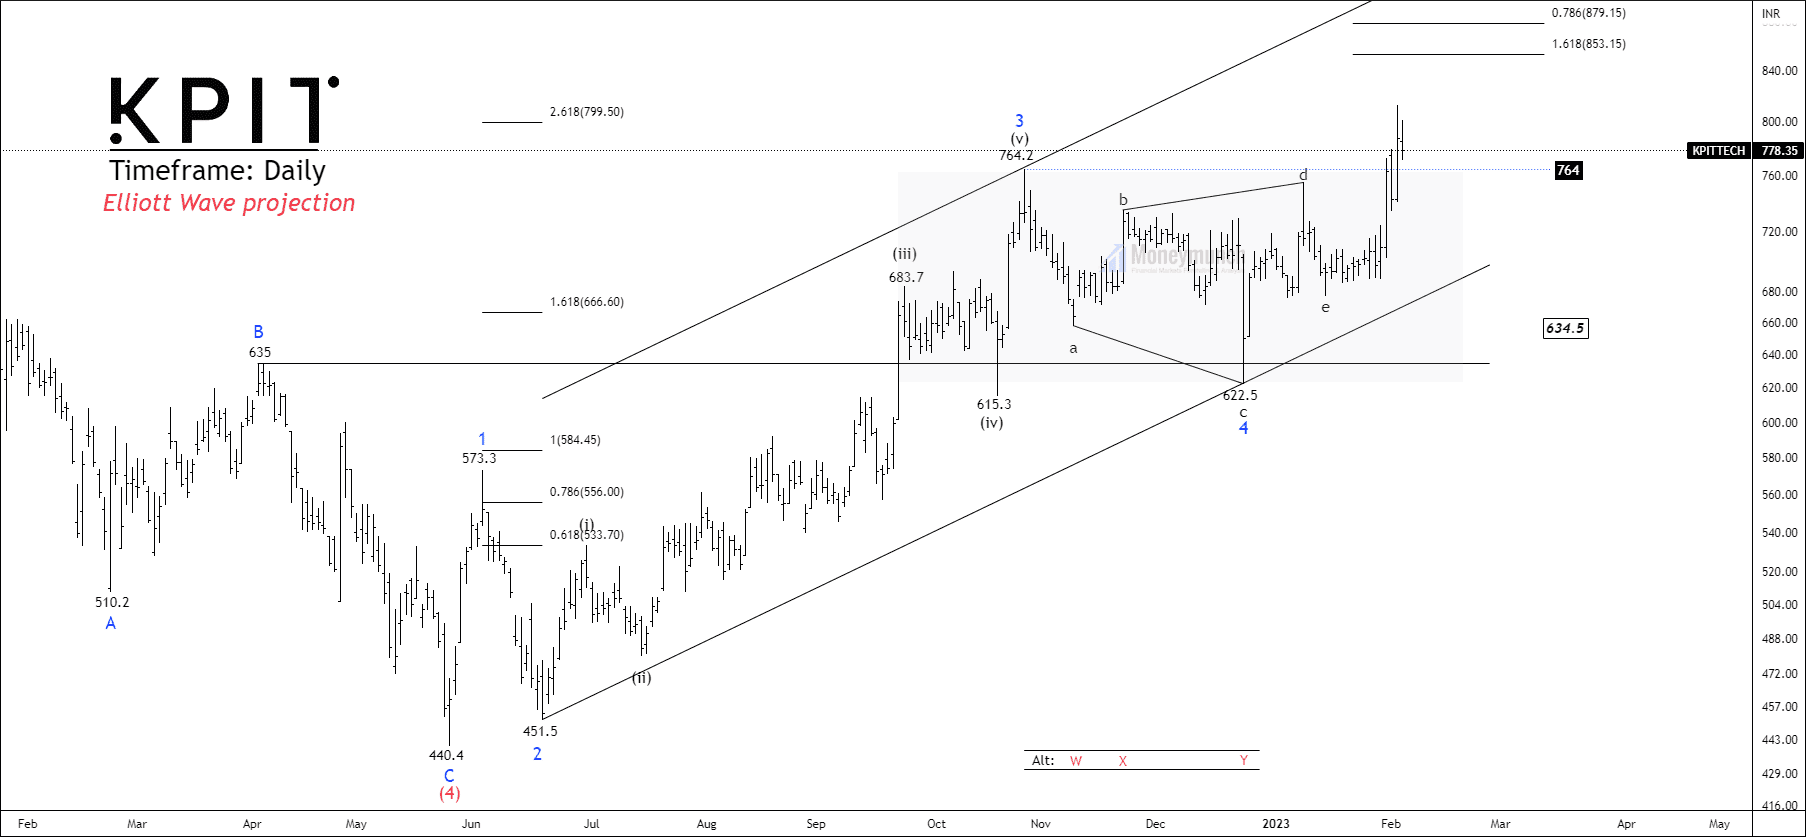
Timeframe: Daily
After zooming in on the daily chart, We can see sub-waves of impulsive waves (5). All rules stated previously are being followed by the price structure. Currently, the price has accomplished the triangle of the 4th sub-wave and broken out the corrective sub-channel of wave 4.
Fibonaaci Relationship:
- Wave 2 has constructed a single zigzag and retraced 0.786 of wave (1).
- Wave 4 has formed a triangle and retraced 0.5 of wave (3).
- Wave 3 extended 2.168 of wave 1.
The Ending Point:
- Wave 5 can occur near reverse Fibonacci retracement 1.618 at 853.
- Wave 5 can accomplish nearly 0.786 Fibonacci retracement at 879.15 of waves 1 through 3.
- Wave (5) can finish near the upper band of the channel at 920.
Trade Setup:
Safe traders can enter the trade after a reverent pullback to minimize the risk. In order to trade this setup, traders can set the following targets: 853 – 879 – 920+.
Get free important share market ideas on stocks & nifty tips chart setups, analysis for the upcoming session, and more by joining the below link: Stock Tips
Have you any questions/feedback about this article? Please leave your queries in the comment box for answers.
Great work dear
Thank you for this research report