
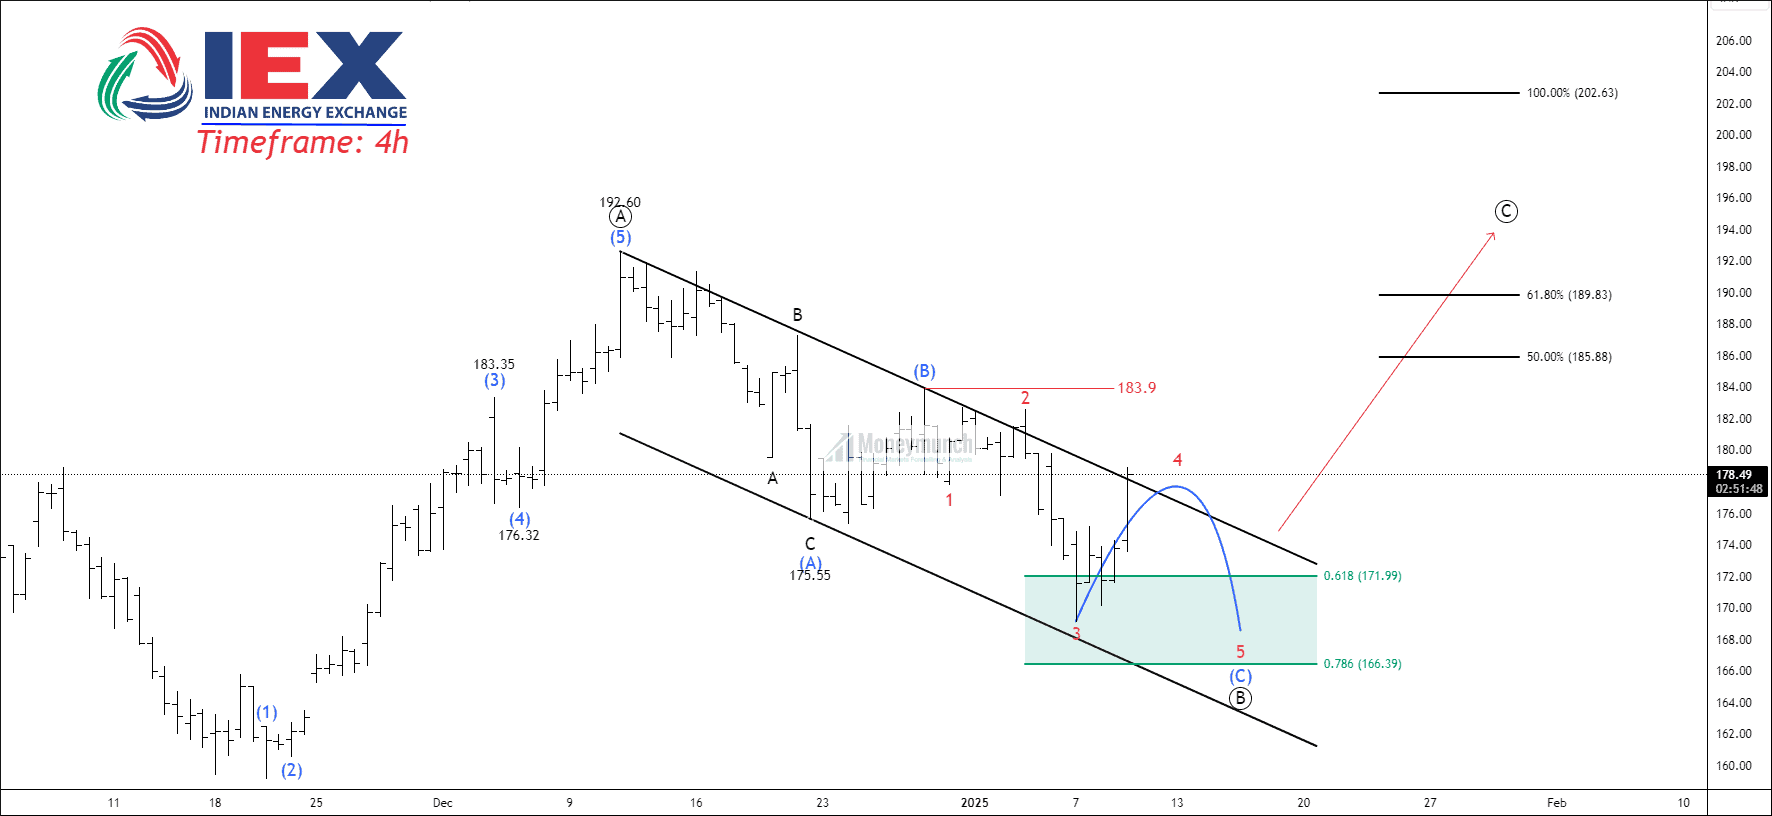
NSE IEX – Elliott Wave Projection
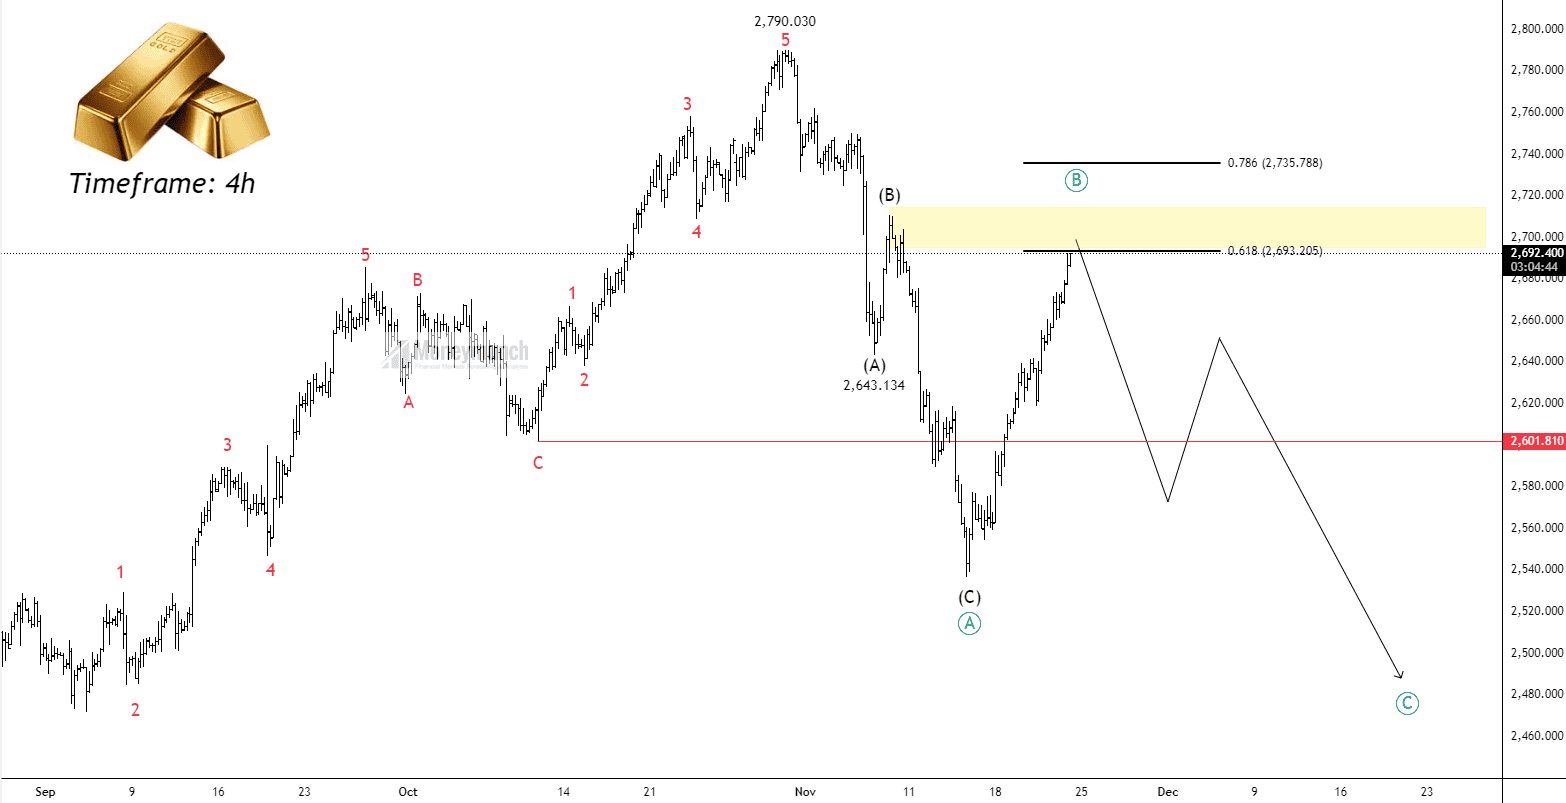
XAUUSD: Corrective Phase Setting the Stage for a Bull Run
Techniques and Tricks for Managing Naked Call/Put Risks
| Technique | Effectiveness (1-5) | When to Use | Why to Use | Advantages | Disadvantages |
|---|---|---|---|---|---|
| Hedging with Protective Options (Convert to Spread) | 5 (Highly Effective) | Use when you want to cap risk while still collecting premiums. | Convert a Naked Call to a Bear Call Spread or a Naked Put to a Bull Put Spread to limit risk and define losses. | Limits losses to the difference between strike prices. Best for risk-averse traders who still want premium collection. | Premium collected is smaller due to buying the protective option, limiting potential profit. |
| Use Stop-Losses | 4 (Very Effective) | Use when you want to automatically exit a position if the market moves against you. | Stop-loss orders help cut losses before they become too large, preventing catastrophic losses in fast-moving markets. | Simple and automated, reduces losses before they escalate. Suitable for volatile markets. | May trigger too early in volatile or gap markets, causing unexpected exits. |
| Rolling the Position | 3 (Moderately Effective) | Use when the market is moving toward your strike price, but you want to avoid immediate loss. | Roll the option to a later expiration or different strike price to widen the profit range and reduce immediate risk. | Extends time and widens the range. Good for managing short-term losses and adjusting the strategy to suit market movements. | Postpones the risk rather than eliminating it. Requires constant monitoring and may still lead to losses later. |
| Monitor Volatility | 3 (Moderately Effective) | Use before entering a naked position, especially during periods of low volatility. | Monitor Implied Volatility (IV) to avoid selling naked options when volatility is high and the market is likely to move sharply. | Helps reduce the risk of sudden large market movements. Best used when volatility is low, to ensure stable conditions. | May limit opportunities during high volatility periods when option premiums are higher, which could offer larger profits. |
| Position Sizing | 5 (Highly Effective) | Use for every trade to prevent over-leveraging and limit exposure. | Keep the size of the naked option position small (5-10% of your capital) to minimize potential losses if the trade goes wrong. | Limits the damage if the market moves against you. It ensures that even a bad trade doesn’t wipe out your entire portfolio. | Smaller positions mean smaller potential profits, so the trade-off is lower returns for lower risk. |
| Delta Hedging | 3 (Moderately Effective) | Use when the market moves against your naked options, and you want to offset losses. | Buy or sell the underlying asset (stock or futures) to hedge your position and reduce directional risk. | Reduces losses as the market moves, offering real-time protection. Suitable for advanced traders who can actively manage their portfolios. | More complex and requires constant monitoring and adjustments to maintain the hedge. Not suitable for all traders, especially beginners. |
| Avoid Naked Options in Volatile Markets | 5 (Highly Effective) | Use when volatility is high or during uncertain times (e.g., earnings, political events). | Simply avoid trading naked options during highly volatile periods to reduce the risk of large, sudden market moves. | Easiest way to prevent large losses. Helps traders avoid the worst-case scenarios of selling naked options during uncertain market conditions. | Avoiding trades during these periods could result in missed opportunities, especially if volatility is expected to settle soon. |
When dealing with the disadvantages of the Naked Call/Put Strategy, it’s important to have a risk management plan in place to protect your capital from the unlimited risk (in the case of Naked Calls) or substantial losses (in the case of Naked Puts). Here are some techniques and plans to mitigate those risks:
1. Hedging with Protective Options (Convert to Spread)
One of the most effective ways to limit the risk of a Naked Call/Put is to buy a protective option at a different strike price, converting the strategy into a spread.
- For a Naked Call:
Convert it into a Bear Call Spread by buying a higher strike call option. This limits your upside risk.- Example: If you sell a ₹100 strike call, you could buy a ₹110 strike call to cap your losses. This way, if the stock rises above ₹100, your maximum loss is limited to the difference between the two strike prices minus the premium collected.
- For a Naked Put:
Convert it into a Bull Put Spread by buying a lower strike put option. This limits your downside risk.- Example: If you sell a ₹100 strike put, you could buy a ₹90 strike put. This limits your losses if the stock price falls below ₹100.
Pros:
- Your risk becomes limited instead of unlimited, making the trade more manageable.
- You still collect premium, but now with defined risk.
2. Use a Stop-Loss or Mental Stop
To manage potential losses, setting a stop-loss is a straightforward but effective method. A stop-loss automatically closes your position when the market moves against you by a certain amount.
- For a Naked Call:
If the stock price rises toward your strike price, set a stop-loss to automatically exit the position when the stock crosses a predefined price. For example, if you sell a ₹100 strike call, set a stop-loss at ₹105. - For a Naked Put:
Similarly, if the stock price is falling toward your put strike, set a stop-loss just above the strike price to minimize losses. For example, if you sell a ₹100 strike put, set a stop-loss at ₹95.
Pros:
- It helps you exit the position early before the losses become too large.
- Suitable for volatile markets where prices can move rapidly.
Cons:
- Gaps in the market can sometimes result in stop-loss orders being triggered at unfavorable prices.
3. Rolling the Position
If the stock price moves close to the strike price of your naked option, you can roll the option to a further expiration date or a different strike price. This buys you more time and reduces the risk of the option being exercised.
- For a Naked Call:
If the stock price is moving up toward your sold call strike, you can buy back the call and sell a higher strike call with a later expiration. This gives you a new range to work with. - For a Naked Put:
If the stock price is falling, you can buy back the sold put and sell a lower strike put with a later expiration. This allows you to move the risk further away.
Pros:
- It helps avoid immediate losses by giving you more time or a wider range.
- Allows you to stay in the trade without taking a hit if the market moves sharply.
Cons:
- Rolling doesn’t eliminate the risk, it just postpones it. If the market continues to move against you, you could face losses later.
4. Monitor Volatility (Use Implied Volatility to Your Advantage)
Since implied volatility (IV) affects option prices, understanding and monitoring volatility can help manage risk. You can avoid selling naked options in high-volatility environments because this increases the chance of large price movements.
- For Naked Calls and Puts:
When implied volatility is high, options premiums are larger, but the risk of a significant price move is also greater. You can either avoid the trade or use a smaller position size in such situations.
Pros:
- Reduces the risk of getting caught in a sharp market move due to high volatility.
- Helps you enter the trade when market conditions are more stable.
Cons:
- If volatility suddenly increases after you’ve taken the position, you might still face unexpected risk.
5. Position Sizing (Avoid Overleveraging)
One of the simplest risk management strategies is to keep your position size small. By only using a small portion of your capital for any naked position, you reduce the risk of catastrophic losses.
- For Naked Call and Put:
Instead of selling large amounts of naked options, use only a small fraction of your portfolio (e.g., 5-10%). This way, if the trade goes against you, it won’t wipe out your entire portfolio.
Pros:
- Limits your exposure to manageable losses.
- Allows you to maintain more control over your overall capital.
Cons:
- Smaller positions mean smaller profits, but this is the trade-off for managing risk.
6. Delta Hedging
To protect yourself against large directional moves, you can use delta hedging. This involves buying or selling the underlying asset (e.g., stock or futures) to offset the risk of a move against your naked options position.
- For a Naked Call:
If the stock price is rising, you can buy shares or futures contracts to hedge your exposure. This will offset the losses from the call option as the stock price rises. - For a Naked Put:
If the stock price is falling, you can sell shares or futures contracts to offset the risk of a falling stock price.
Pros:
- Allows you to actively mitigate risk as the market moves.
- Can be useful in volatile markets to reduce directional exposure.
Cons:
- Requires constant monitoring and adjustments.
- More complex and may not be suitable for all traders.
7. Avoid Naked Options in Volatile Markets
Simply put, avoid using the Naked Call/Put strategy when the market is highly volatile, such as around earnings announcements, economic reports, or political events. These times are when the market is more likely to experience big moves, which can lead to heavy losses for naked options traders.
Pros:
- Reduces the chances of getting caught in sharp market moves.
- Helps avoid taking unnecessary risks during uncertain times.
Conclusion:
The Naked Call/Put Strategy can be very risky due to its unlimited or substantial loss potential. However, with the right risk management techniques, such as hedging, using stop-losses, rolling positions, and position sizing, you can limit your downside while still collecting premiums. Always assess the market conditions, avoid trading in highly volatile periods, and have a defined exit strategy to protect your capital.
Understand The Cycle Of Doom To Make Winning Trades
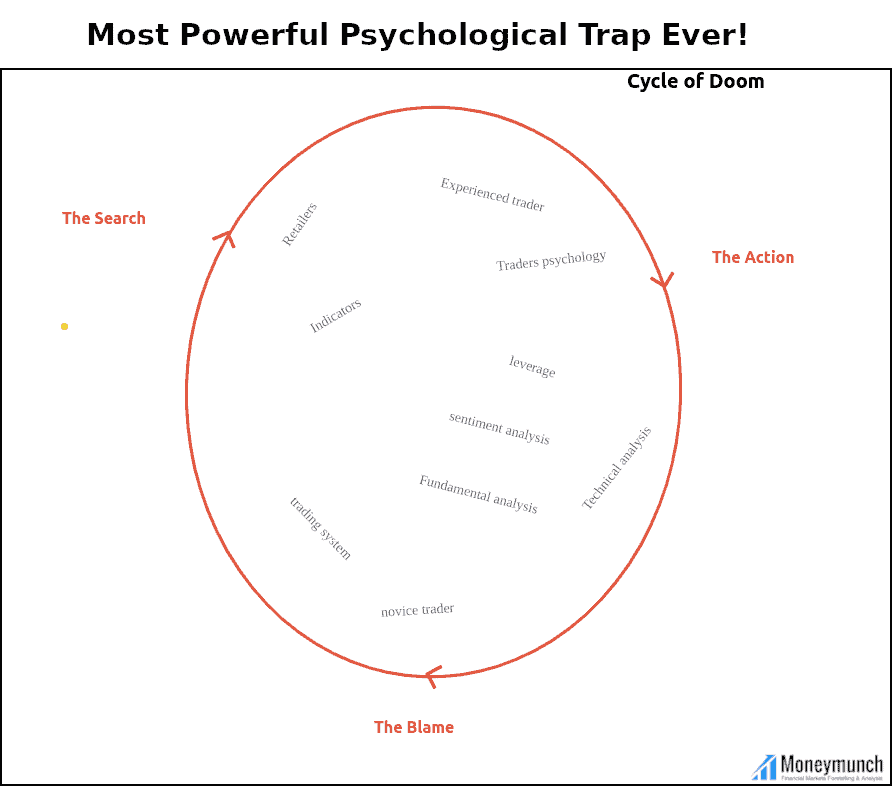
I am starting this topic with a simple question, Are you finding consistent profit in your trading?Continue reading
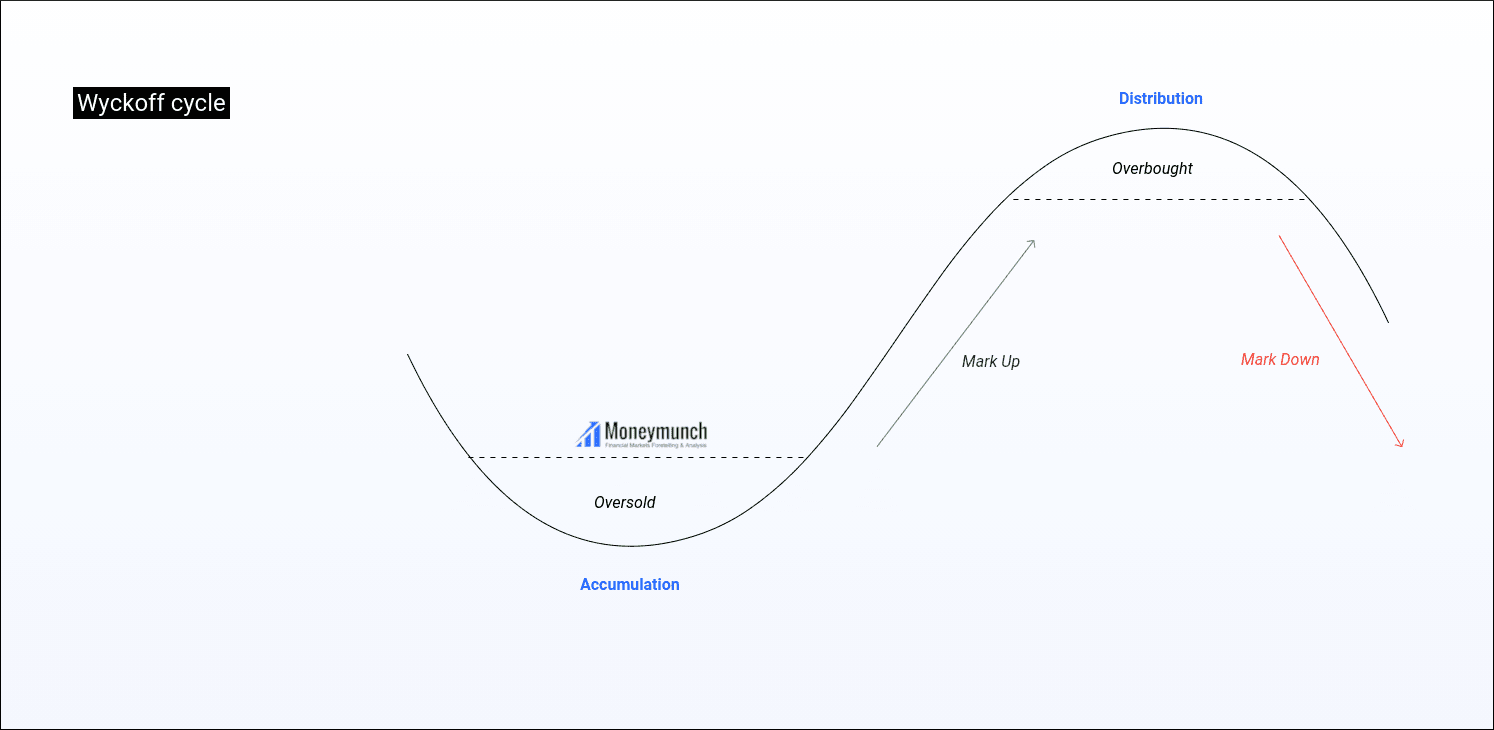
Part 1: A simple analysis of Wyckoff of Wall Street
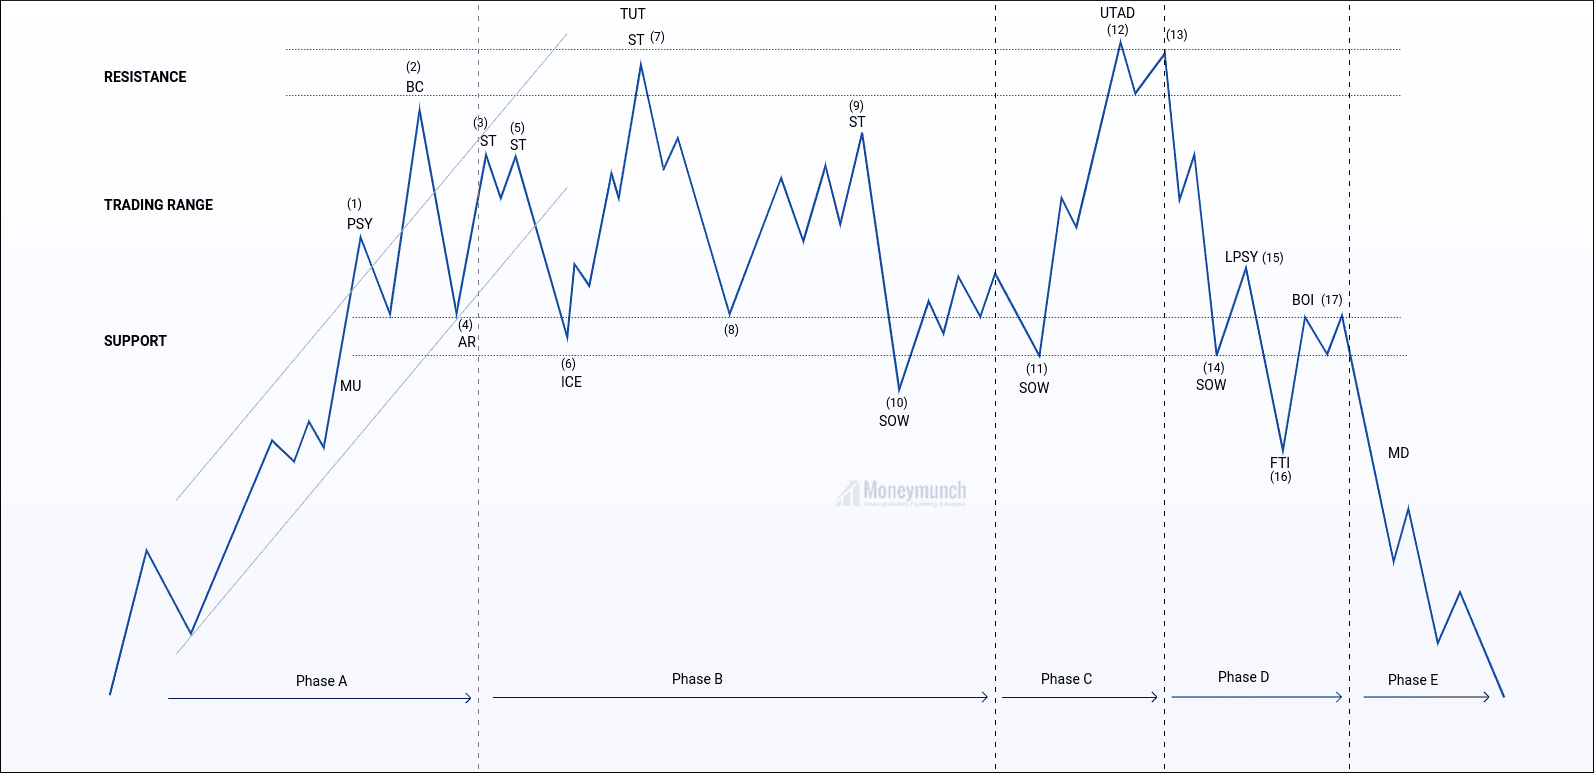
Wyckoff was a pioneer in the technical analysis of the stock market in the early 20th century. He established the Stock Market Academy in 1930. The main course is to introduce how to identify the dealer’s process of collecting chips and the process of distributing chips/judge. Second and third, in the basic law of “causality”, the horizontal P&F count within the trading range represents the cause, and the subsequent price changes represent the result.
Fourth, fifth, the relationship between price and volume on the candlestick chart to analyze the relationship between supply and demand. This law sounds simple, but it takes a long time to practice in order to accurately grasp the volume and price. I heard that Wall Street financial institutions are using Wyckoff’s trading method to judge the trend of the stock market and look for opportunities. So what exactly is Wyckoff’s theory? Today, I will introduce to you the famous Wyckoff transaction method.
The background of the birth of Wyckoff theory
Wyckoff’s theory was proposed by Richard Wyckoff. He was a pioneer in the technical analysis of the stock market in the early 20th century. He and Dow Jones, Gunn, Elliott, and Merrill Lynch are considered the five giants of technical analysis.
Wyckoff is good at summarizing his years of failures in stock investment, and is committed to introducing individual investors to the rules of the game in the market and the impact of large funds behind them.
In 1930, he established the Stock Market Academy. The main course is to introduce how to identify the dealer’s process of collecting chips and the process of distributing chips. Till, there are still many professional traders and institutional investors applying Wyckoff’s method.
Two Five Steps of Wyckoff Analysis
(1) Determine the current state of the market and possible future trends.
Judging the current market trends and future trends can help us decide whether to enter the market and go long or short.
(2) Choose stocks that are consistent with market trends.
In an uptrend, choose stocks that are trending stronger than the market. In a downtrend, choose stocks that are weaker than the market.
(3) Choose stocks whose “reason” equals or exceeds your minimum target.
An important part of Wyckoff’s trading selection and management is his unique method of using long-term and short-term trading point forecasts to determine price targets.
In Wyckoff’s basic law of “causality”, the horizontal P&F count within the trading range represents the cause, and subsequent price changes represent the result.
(4) Make sure that the stock is ready to move.
(5) When the stock market index reverses, there must be contingency measures
Three-quarters of the stocks are moving in line with the market. Grasping the market trends can increase the success rate of transactions.
Continue reading