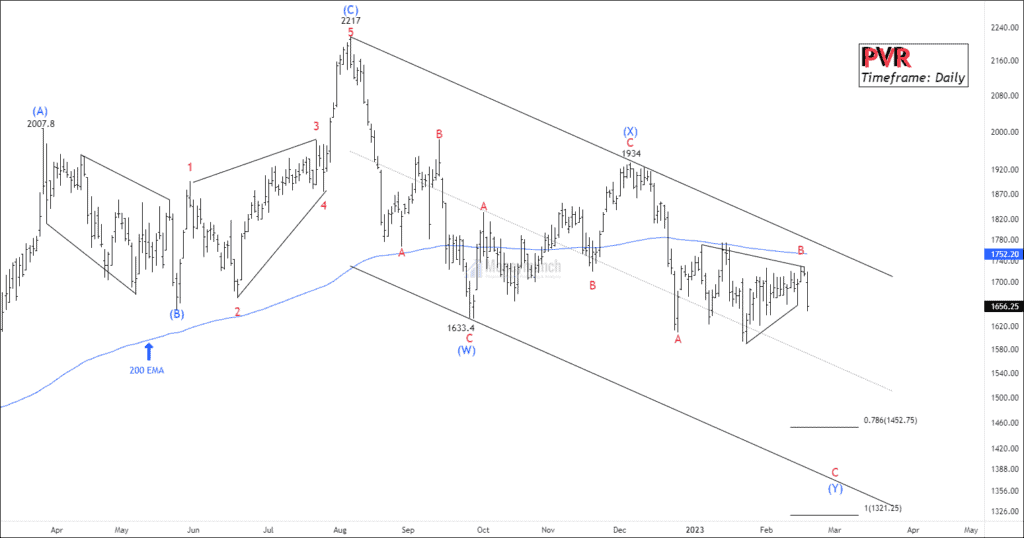

On a daily timeframe, NSE PVR has been trading within a channel for more than 28 weeks. However, the current price is weak as it is trading below the 200 EMA. Wave B was not strong enough to sustain, resulting in choppy price action. The corrective wave b of wave (y) has occurred, and the price has started to fall for wave c of wave (y). Wave (y) has retraced 0.618 Fibonacci extension and is heading towards the 0.786 level.
The cluster range includes:
- 78.6% Fibonacci extension of wave (W) at 1476.5.
- 78.6% Fibonacci of wave A at 1452
- 100% Fibonacci of wave (W) at 1352, where Wave (W) = Wave (Y).
- 100% Fibonacci of wave A at 1321.25, where Wave A = Wave C
In addition, a head and shoulder pattern is visible on the daily timeframe chart with the neckline at 1633. If the price remains below 1657, swing traders can sell for the following targets:
- TP1: 1618
- TP2: 1576
- TP3: 1540
 Unlock This Article
Get free important share market ideas on stocks & nifty tips chart setups, analysis for the upcoming session, and more by joining the below link: Stock Tips
Have you any questions/feedback about this article? Please leave your queries in the comment box for answers.
Superb research ✌🏽
Nice chart nice levels
I want to learn this wave analysis, Please help me.
Perfect Analysis