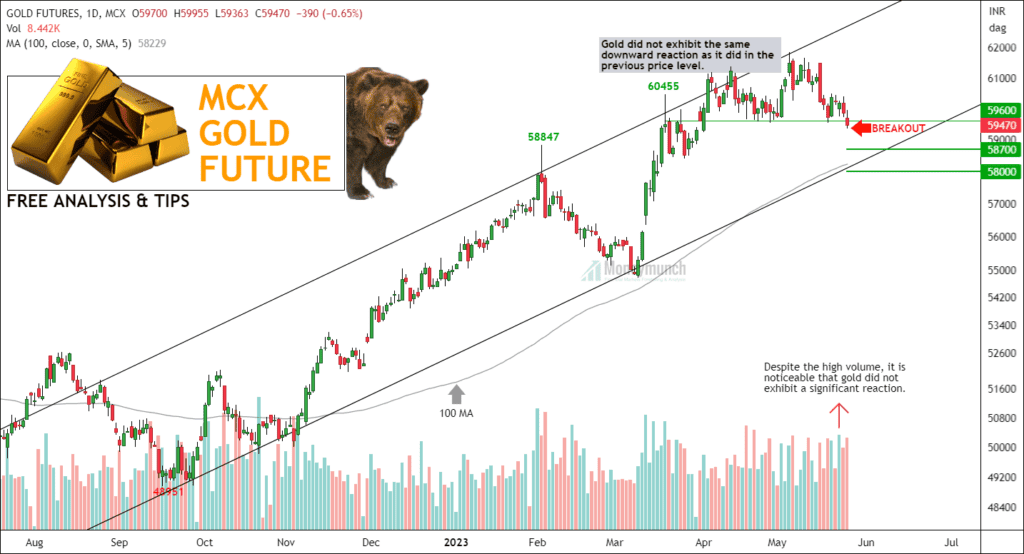
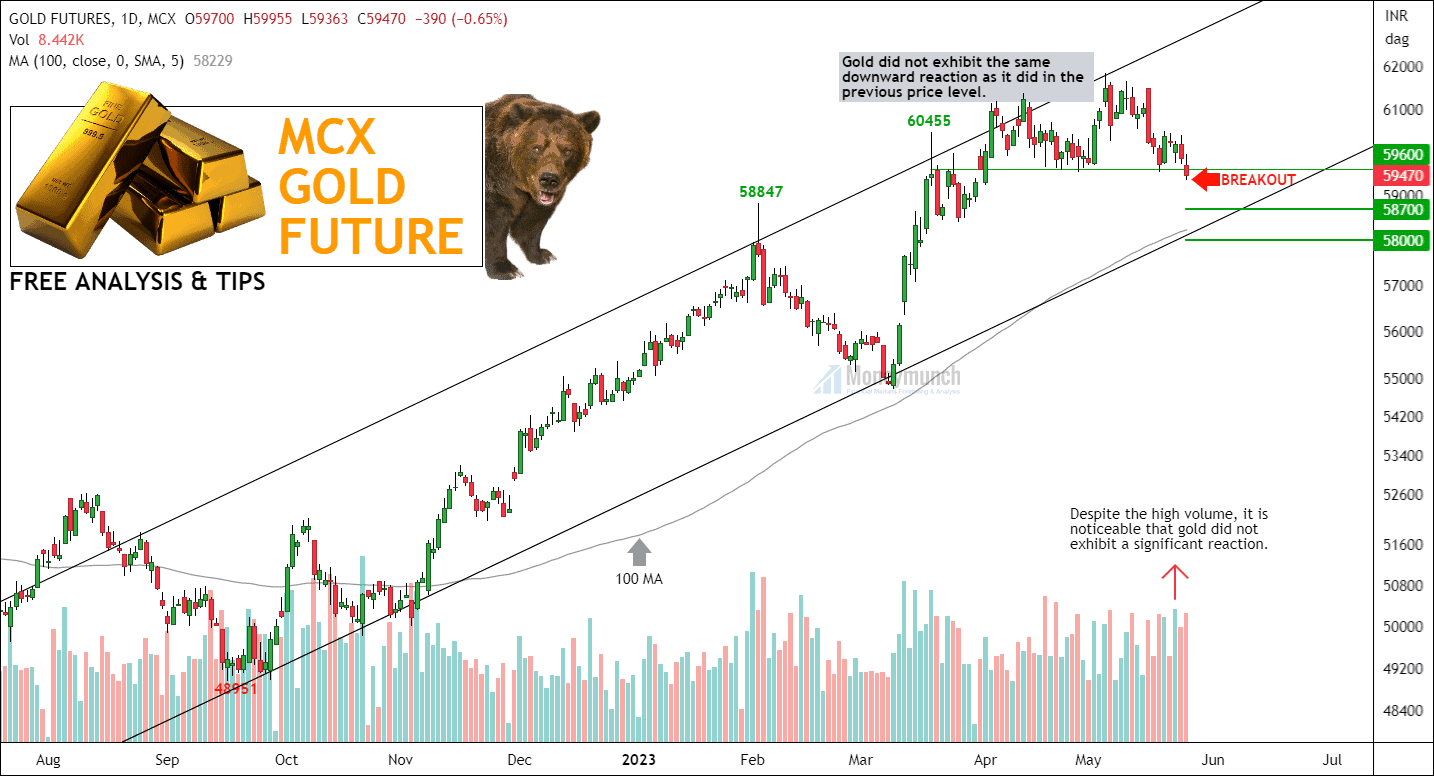
Gold’s Chart Signals Temporary Downtrend but Uptrend Indicators Remain
As per the analysis of the provided chart, the outlook for Gold suggests potential downside towards the levels of 59260, 59000, and 58700. Traders should pay attention to the level of 59600, as a crossover and close above this level could signal a resumption of the uptrend. The presence of the 100-day moving average and a parallel channel on the chart further support the notion of an underlying uptrend, indicating that the current downtrend may be temporary.
In terms of key events for today, the following are of significance:
- 18:00 Core PCE Price Index (MoM) (Apr) and Core Durable Goods Orders (MoM) (Apr) – High impact
- 19:30 Michigan Consumer Expectations & Sentiment (May) – Low impact
- 22:30 U.S. Baker Hughes Oil Rig Count – Medium impact
Additional information and important event details for the upcoming week will be provided shortly.
Get free MCX ideas, chart setups, and analysis for the upcoming session: Commodity Tips →
Have you any questions/feedback about this article? Please leave your queries in the comment box for answers.
Engaging and enlightening!
Well done! The article provided valuable insights in a succinct manner.
A perfect blend of brevity and substance. This analysis deserves high praise