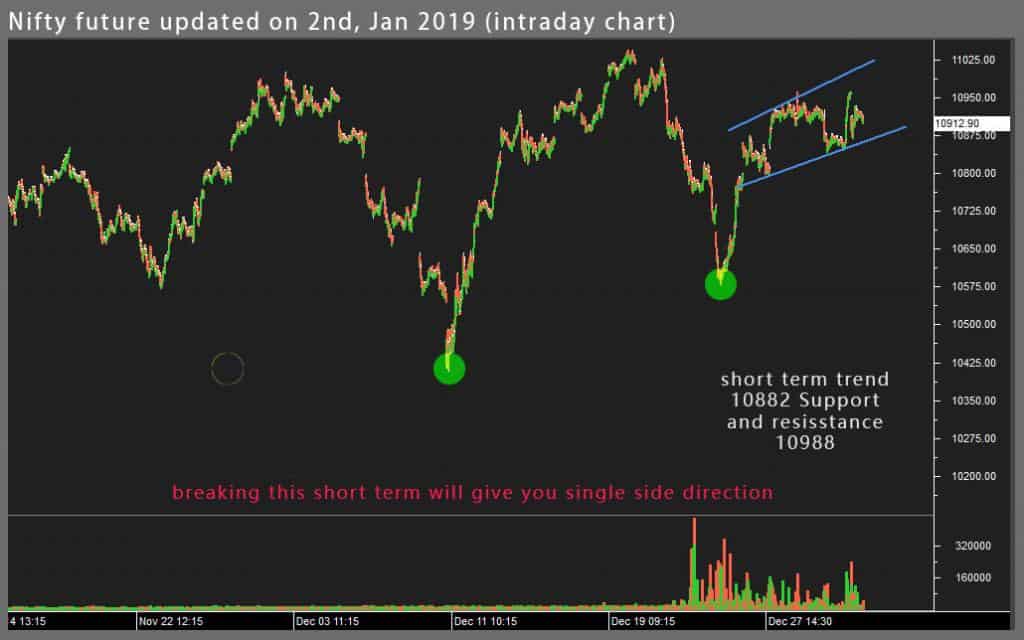
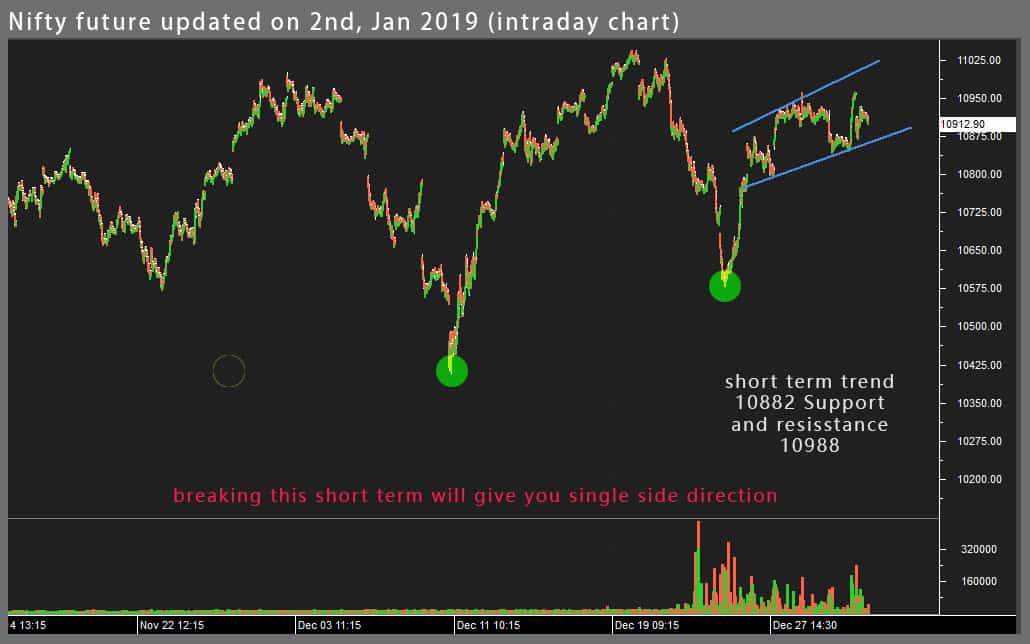
We have found the short term trend over the NF which is intraday between 10878 and 10988 as per chart. Look at the chart.
The support at 10876 nearby, what can keep NF around this level. After breaking. We might see more fall and increase volume to buy PUT 10800 NF strike.
And, another scenario is to act at resistance 10988.
To become a subscriber, subscribe to our free newsletter services. Our service is free for all.
Get free important share market ideas on stocks & nifty tips chart setups, analysis for the upcoming session, and more by joining the below link: Stock Tips
Have you any questions/feedback about this article? Please leave your queries in the comment box for answers.


 Lock
Lock