Have you read the previous research report of Nifty 50?
Click Here – IS NIFTY ABOUT TO RESUME BEARISH THE MOVEMENT?
 BEFORE
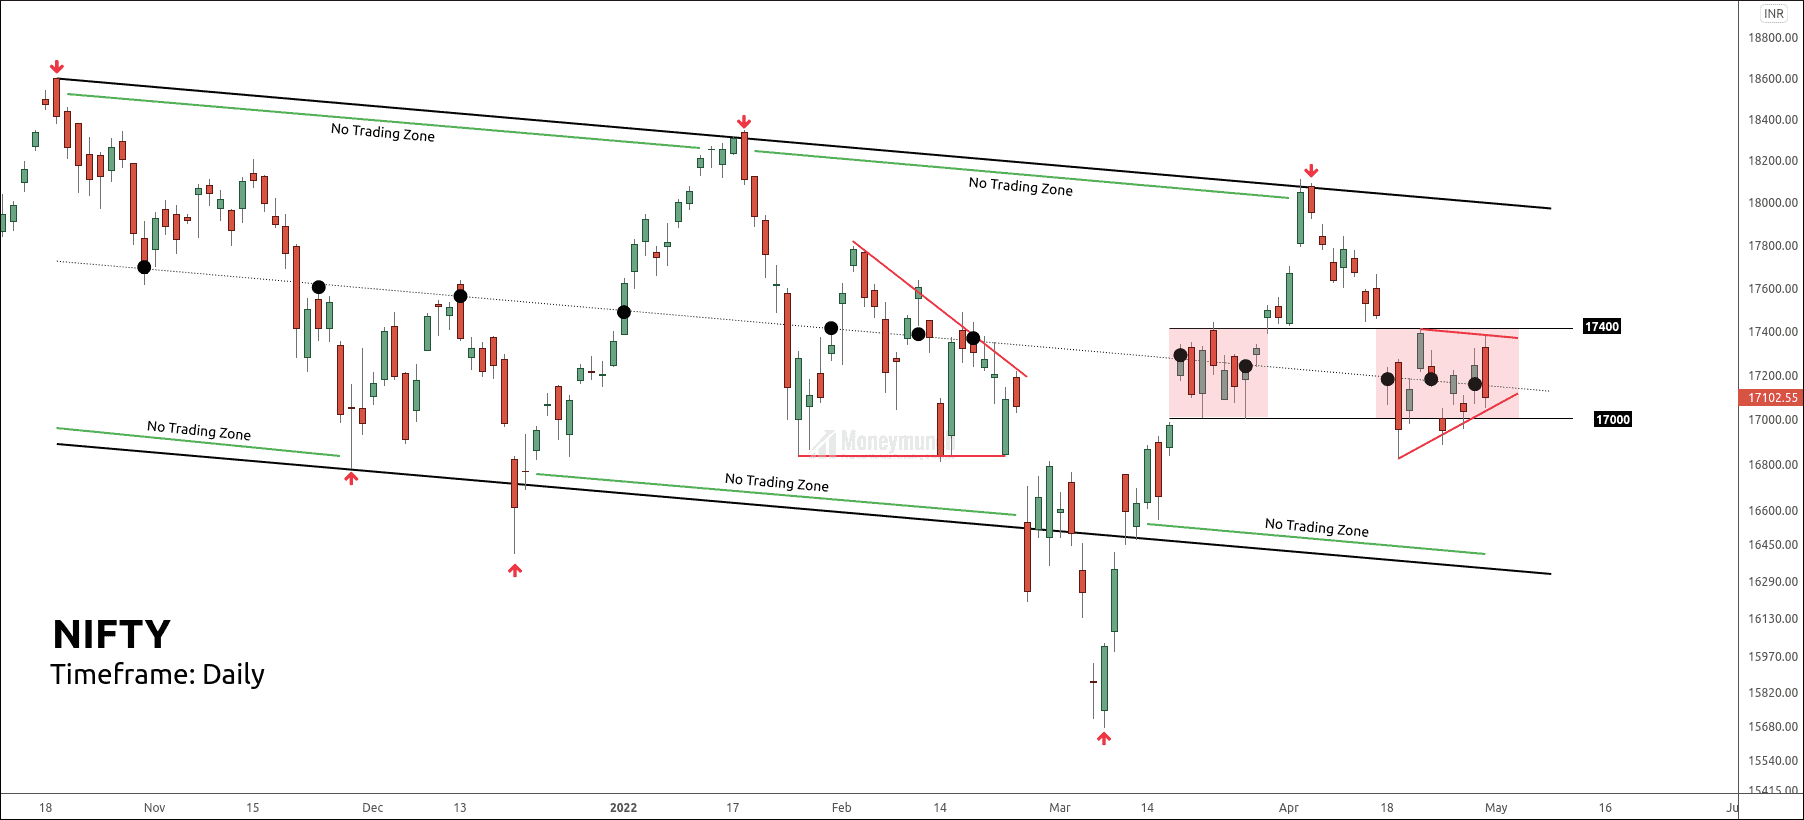
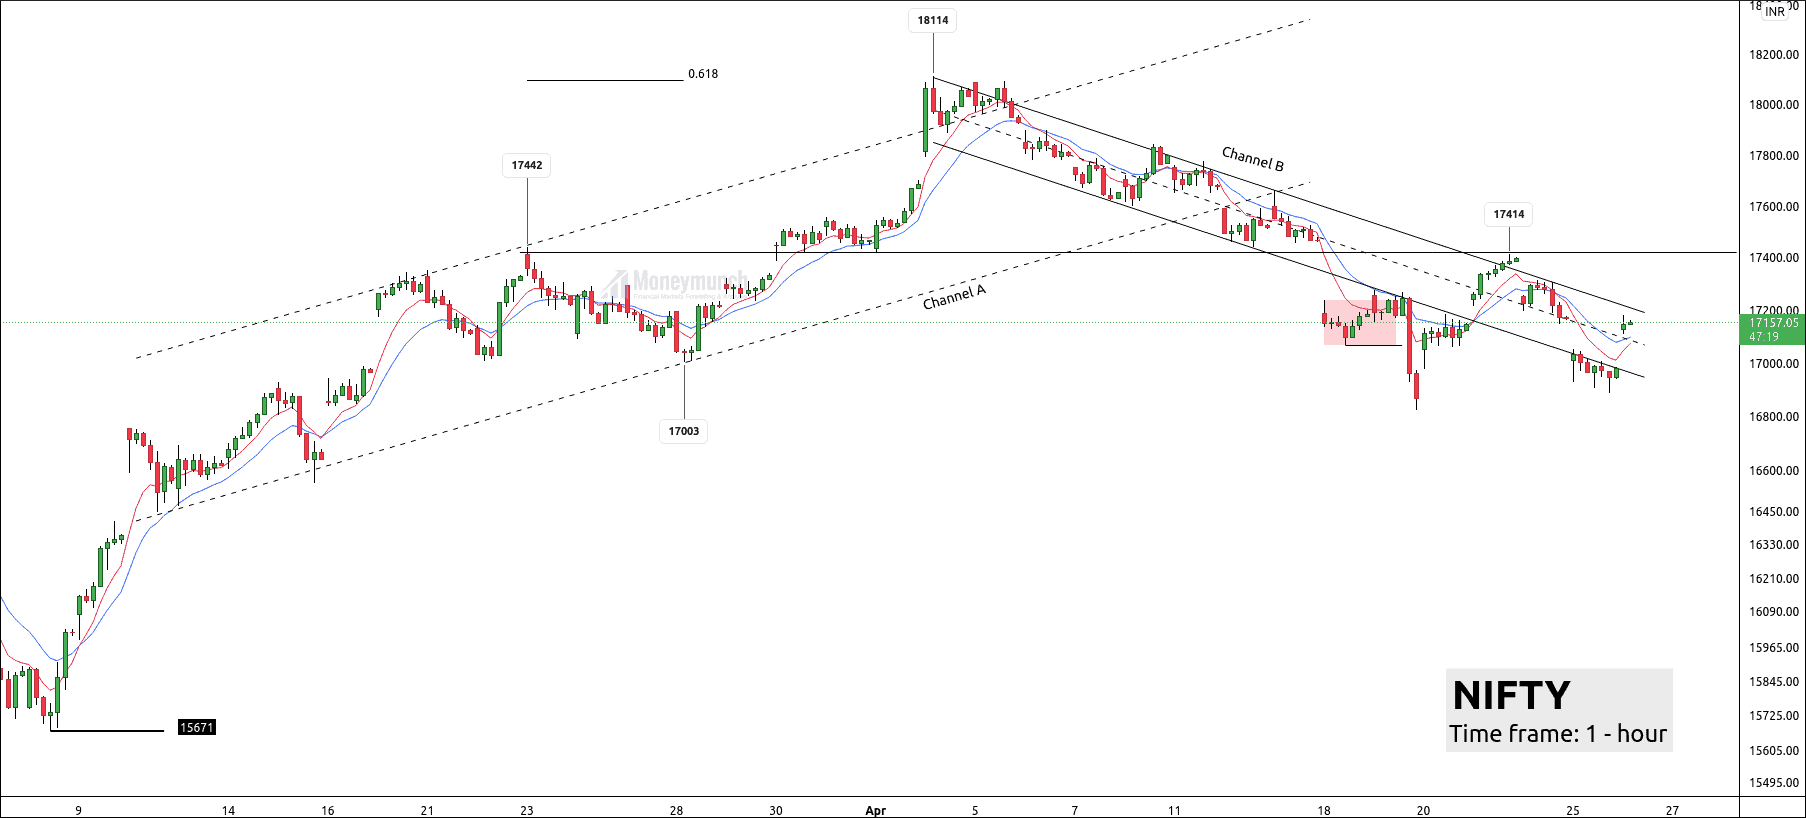
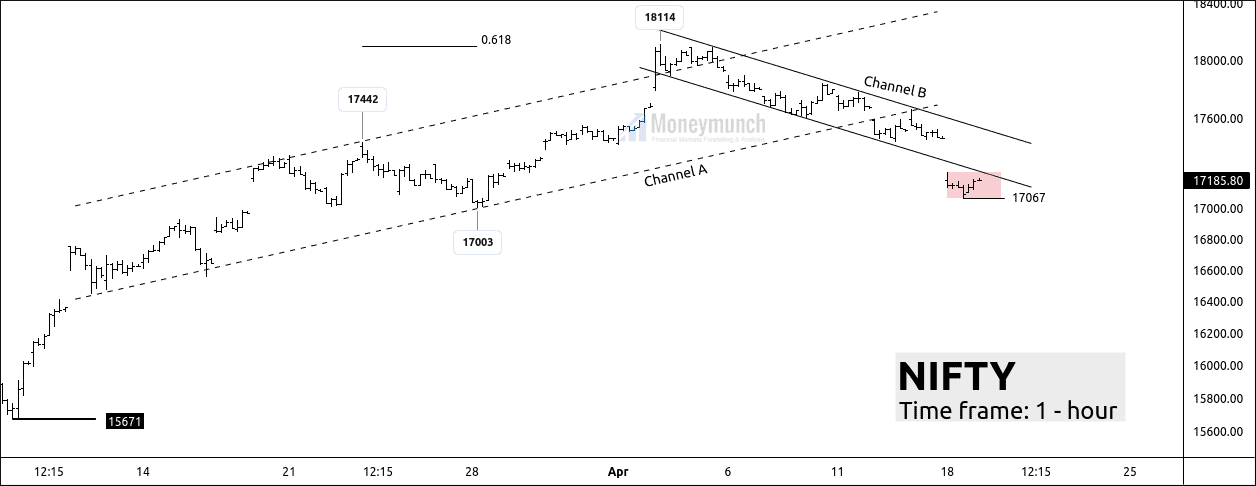
Nifty was in the indecisive movement where the price has formed a triangle on the daily timeframe chart. It was at the control line of the parallel channel.
I had mentioned in bold words, “If the price sustains below 17000, traders can expect good selling up to 16900 – 16821 – 16769.”
 AFTER
AFTER
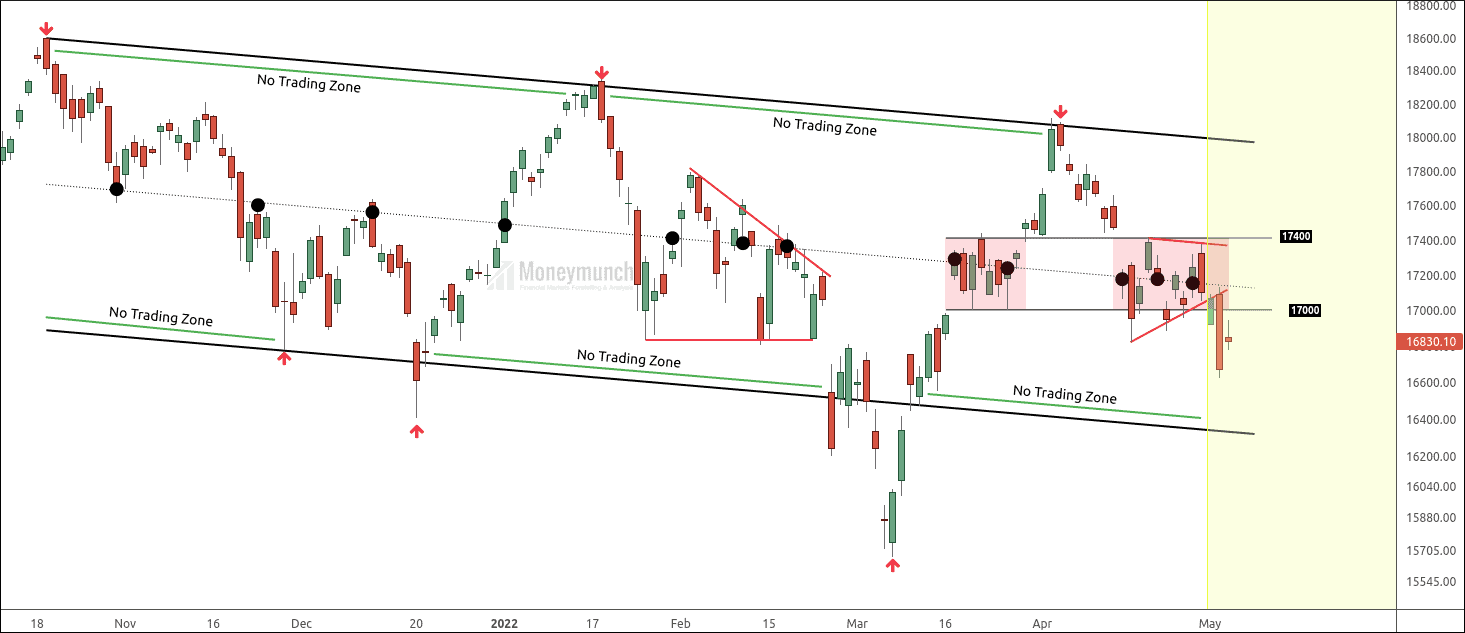
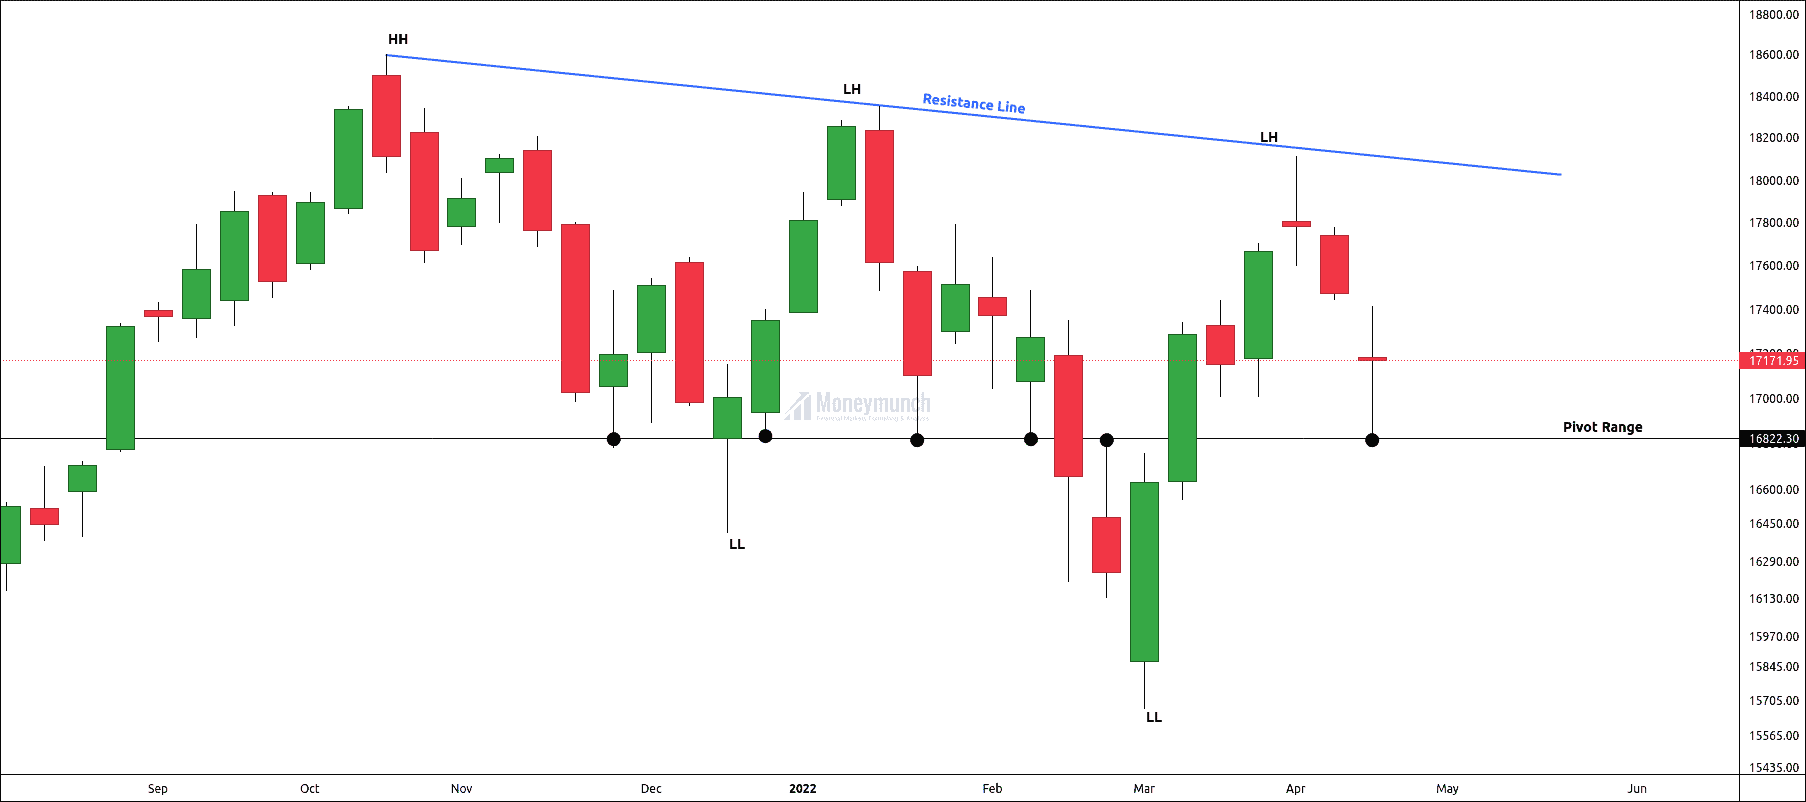
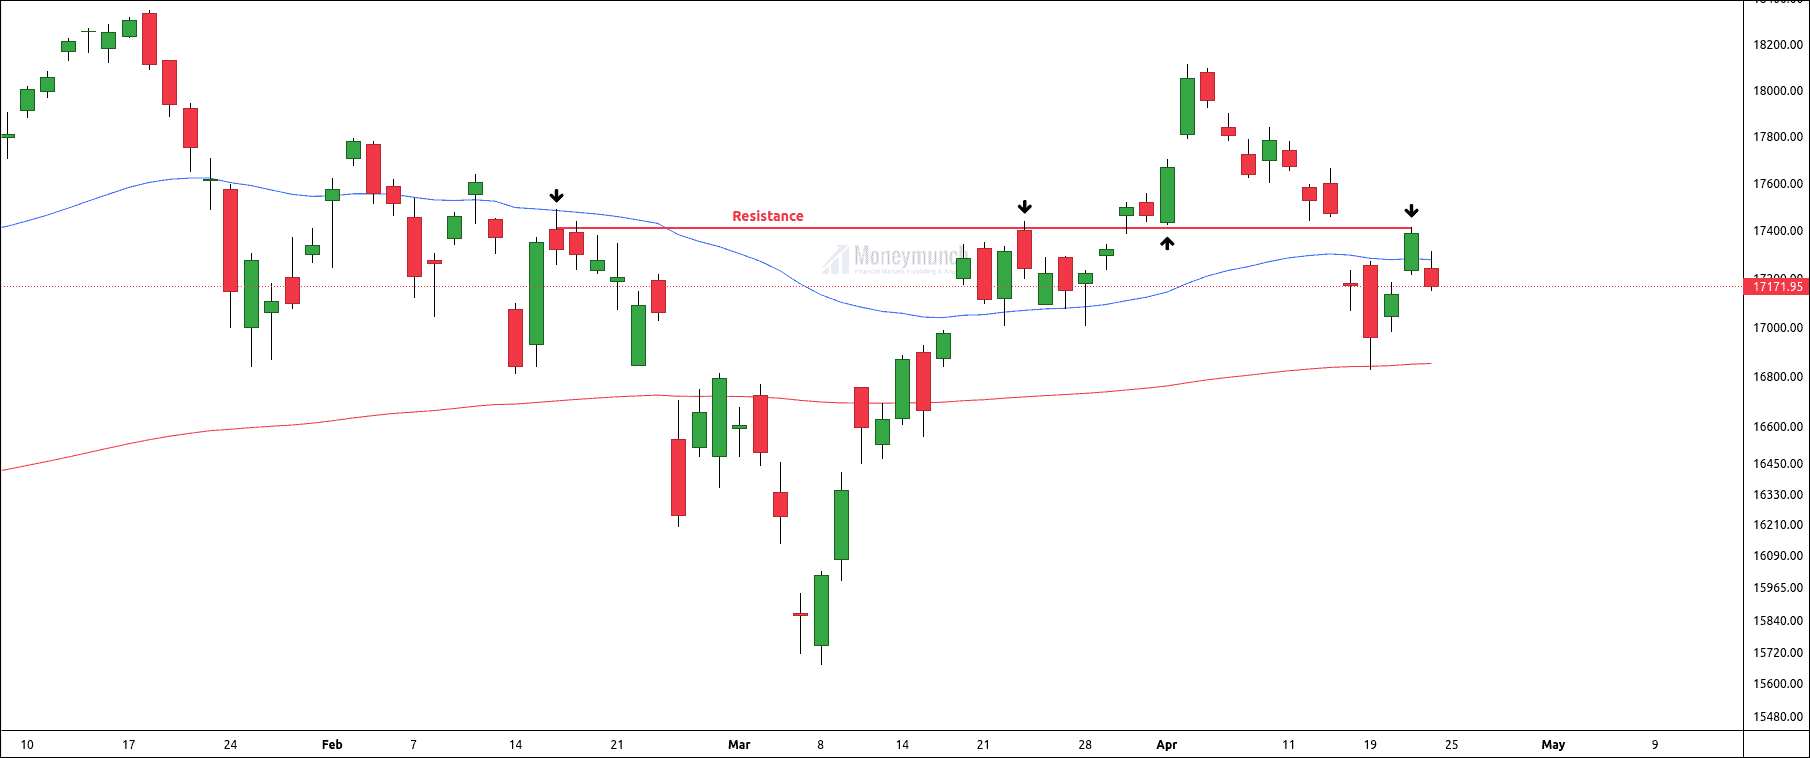
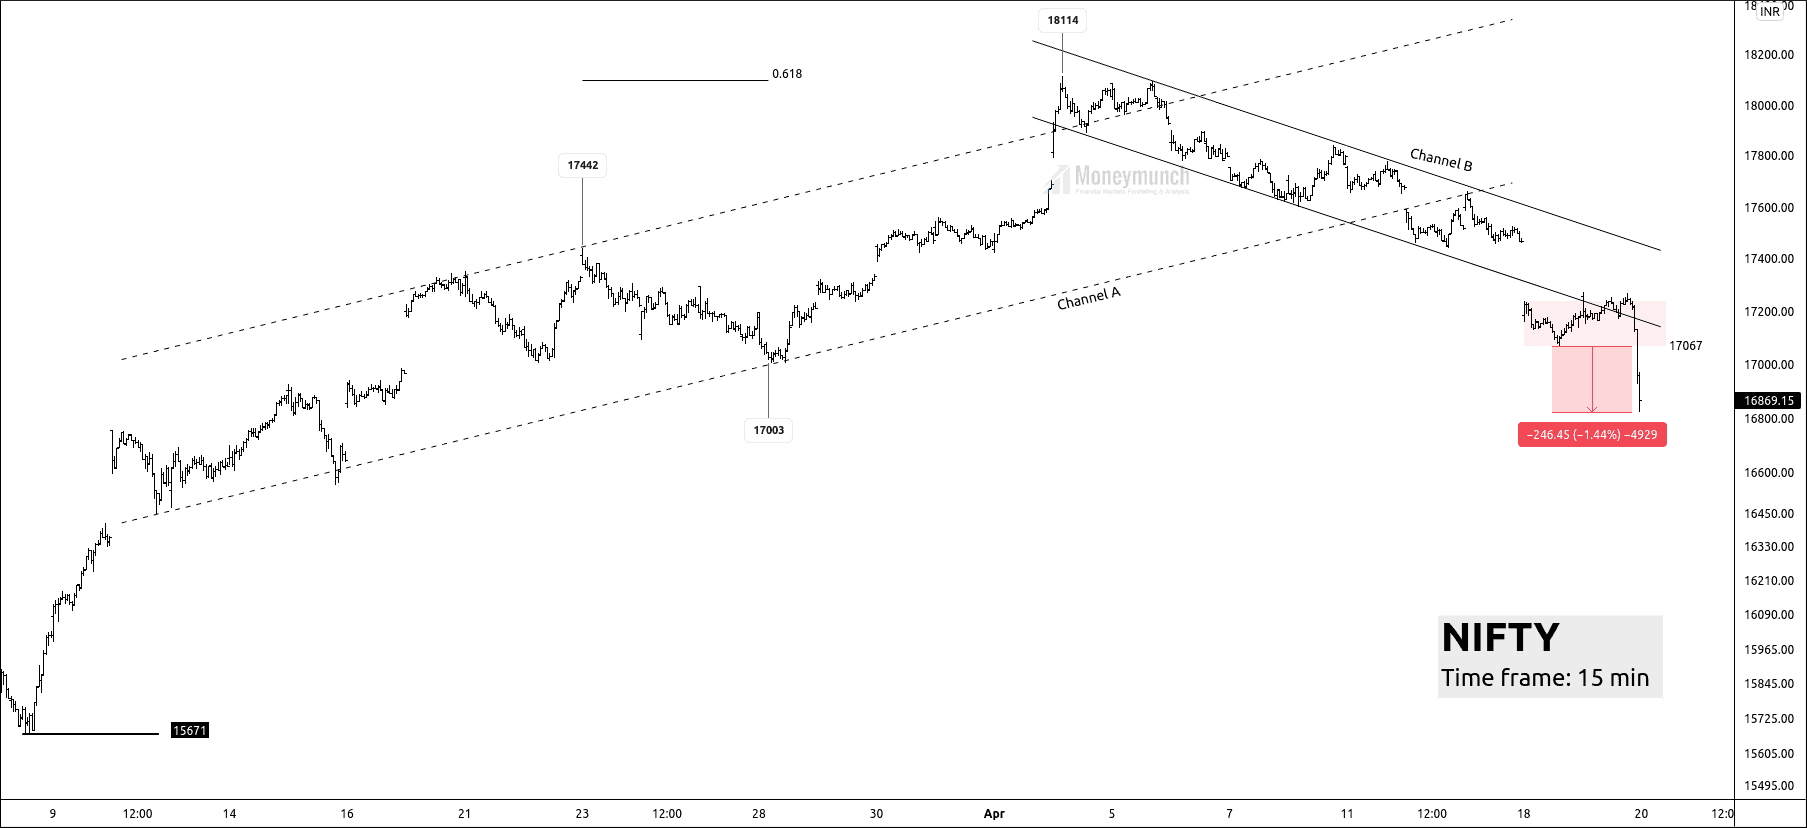
Nifty had broken down the support level of 17000 and started falling for our targets.
4th May 2022:
- 12:10 AM – Nifty reached the first target of 16900.
- 02:05 PM – Nifty touched the second target of 16821.
- 02:10 PM – Nifty hit the final target of 16769.
If you have bought Nifty 5th MAY 17500 PE @99, you can exit your position at @321.
Nifty 5th MAY 16700 PE @22 has made a high of @127.
If you haven’t traded this call, You have missed 400 points in two trading sessions.
 BEFORE
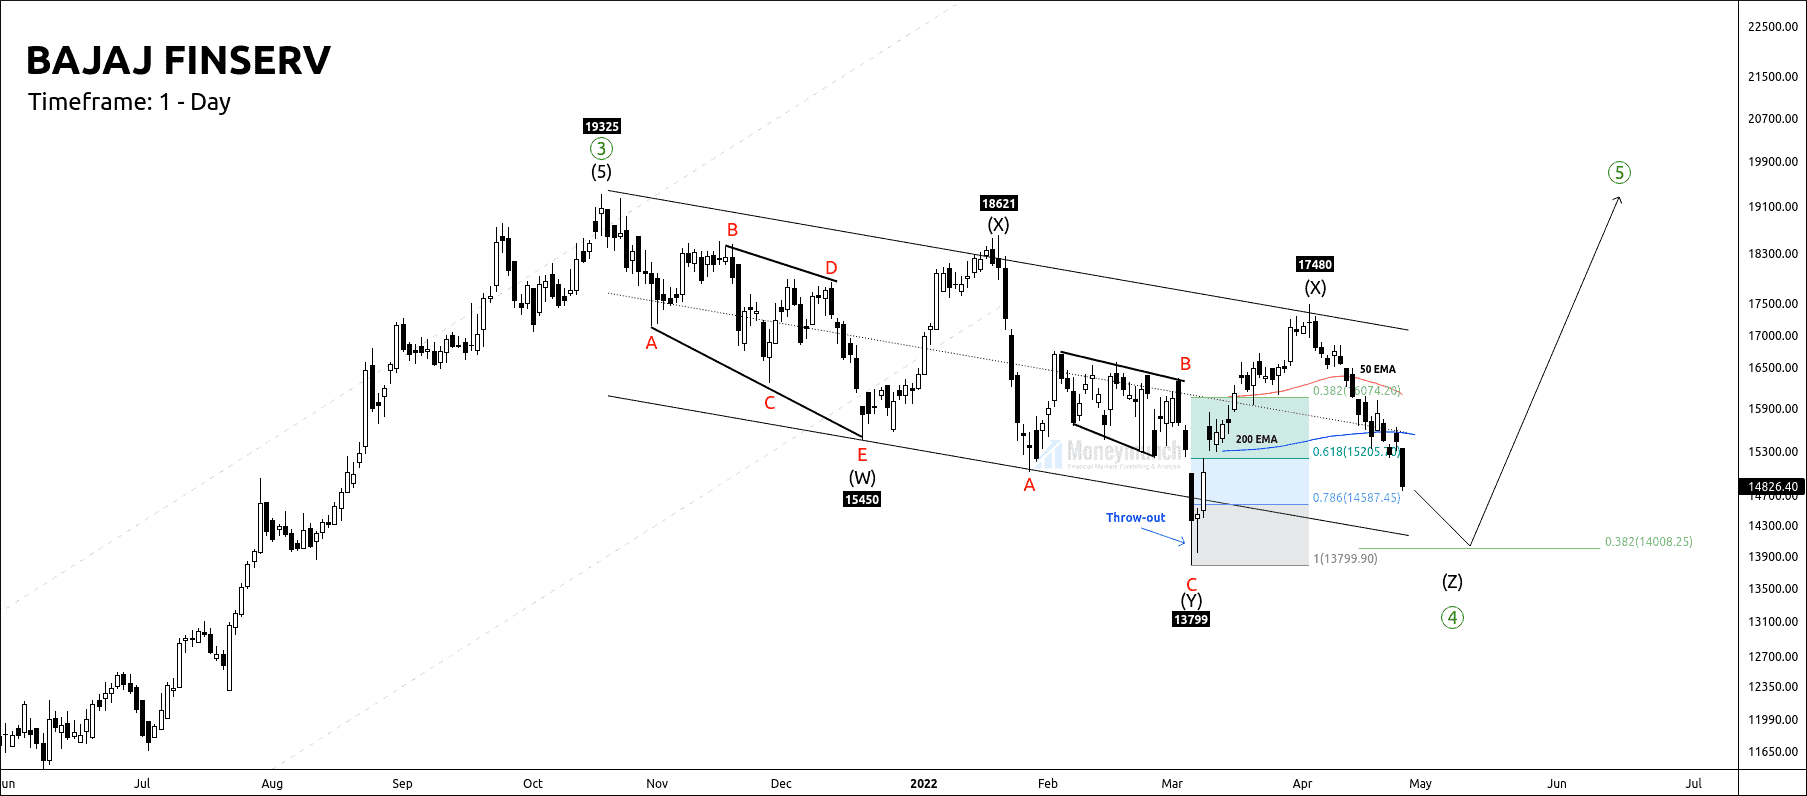
Bajaj Finserv has completed its X wave, and it was ready for the final wave. Wave X is the intermediate wave that connects the two corrective structures (Y) & (Z).
I had written in clear words, “Bajaj Finserv has started it’s final bearish, where we have seen a speculative boom downside. After breaking 50 & 200 EMA, it started falling for wave Z. Traders can expect the following targets: 14631 – 14449 – 14176.”
Do you remember Bajaj Finserv’s wave projection?
Click here – NSE Bajaj Finserv: Elliott Wave Analysis & Tips
 AFTER
AFTER
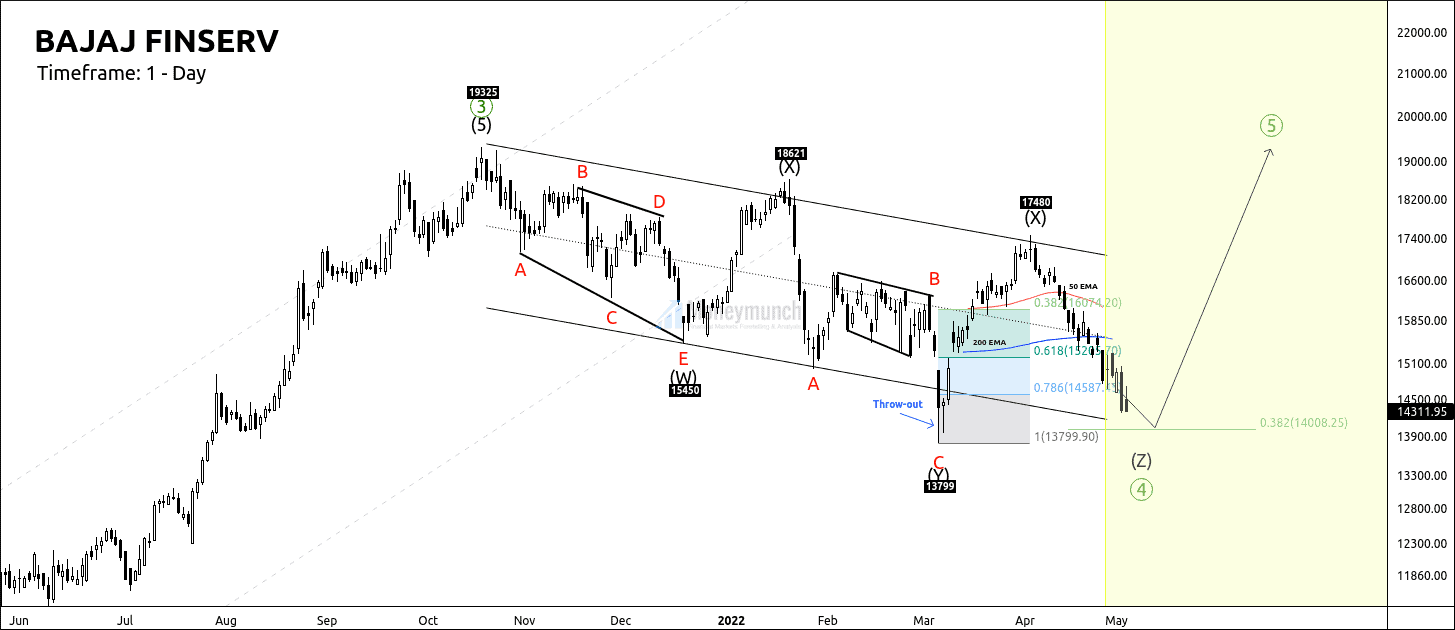
After the breakout of the control line, the prices started falling.
4 May 2022
- 11:45 AM – Bajaj Finserv hit the first target of 14631.
- 2:05 PM – Bajaj Finserv touched the second target of 14449.
5 May 2022
- 2:10 PM – Bajaj Finserv reached the final target of 14176.
If you have traded this setup, you could get a profit of more than 700 points. To become a subscriber, subscribe to our free newsletter services. Our service is free for all.
 Unlock This Article