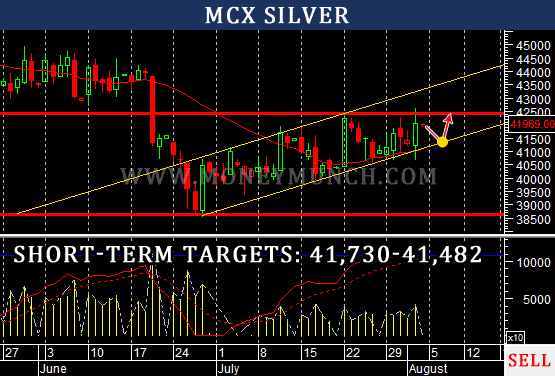
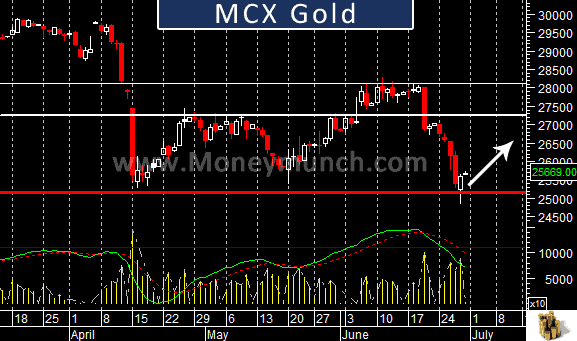
MCX Gold and Silver both closed inverse, do you know why? Sorry, but I will not discuss here about Gold & Silver because it’s available for member in Password zone. To become a subscriber, subscribe to our free newsletter services. Our service is free for all.

Only subscribers can read the full article. Please login to read the entire article.
 Unlock This Article
Only subscribers can read the full article. Please login to read the entire article.

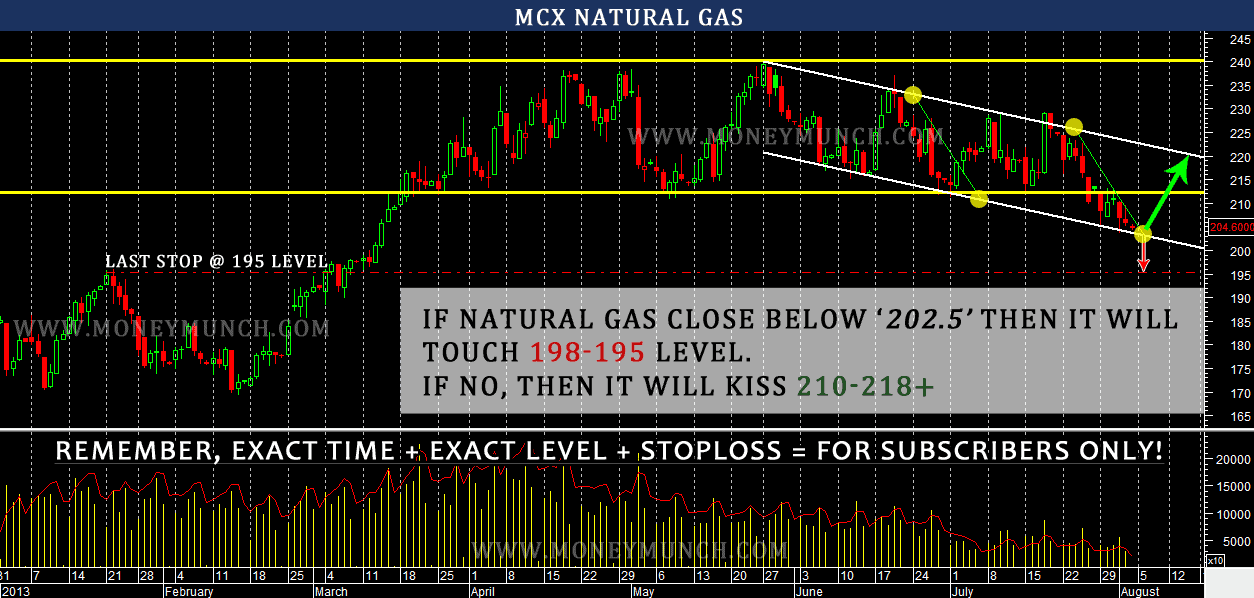
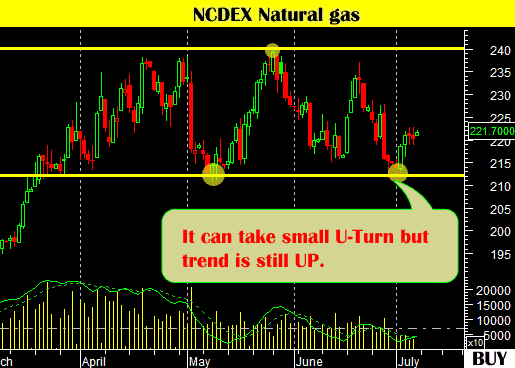
I am not going to explain anything more about natural gas.
Targets: 251-263-275
Hurdle: 240
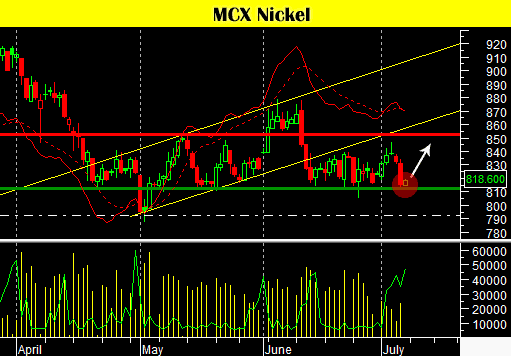
MCX Sell lead between 148-147 S/L: 150 Targets: 144-142-140 Or Once cross and move above 151 then buy it for short term with targets 155-157-160, Choice is yours!


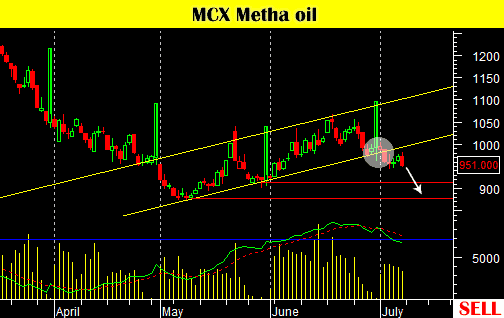
Don’t come in a trap. CPO know well, how to play. I have two live levels for you, Go and sell it @ 572 Targets: 569-565.5 or If CPO cross 576 then buy it for short term with targets: 780-785-789
Continue reading