Timeframe: Daily
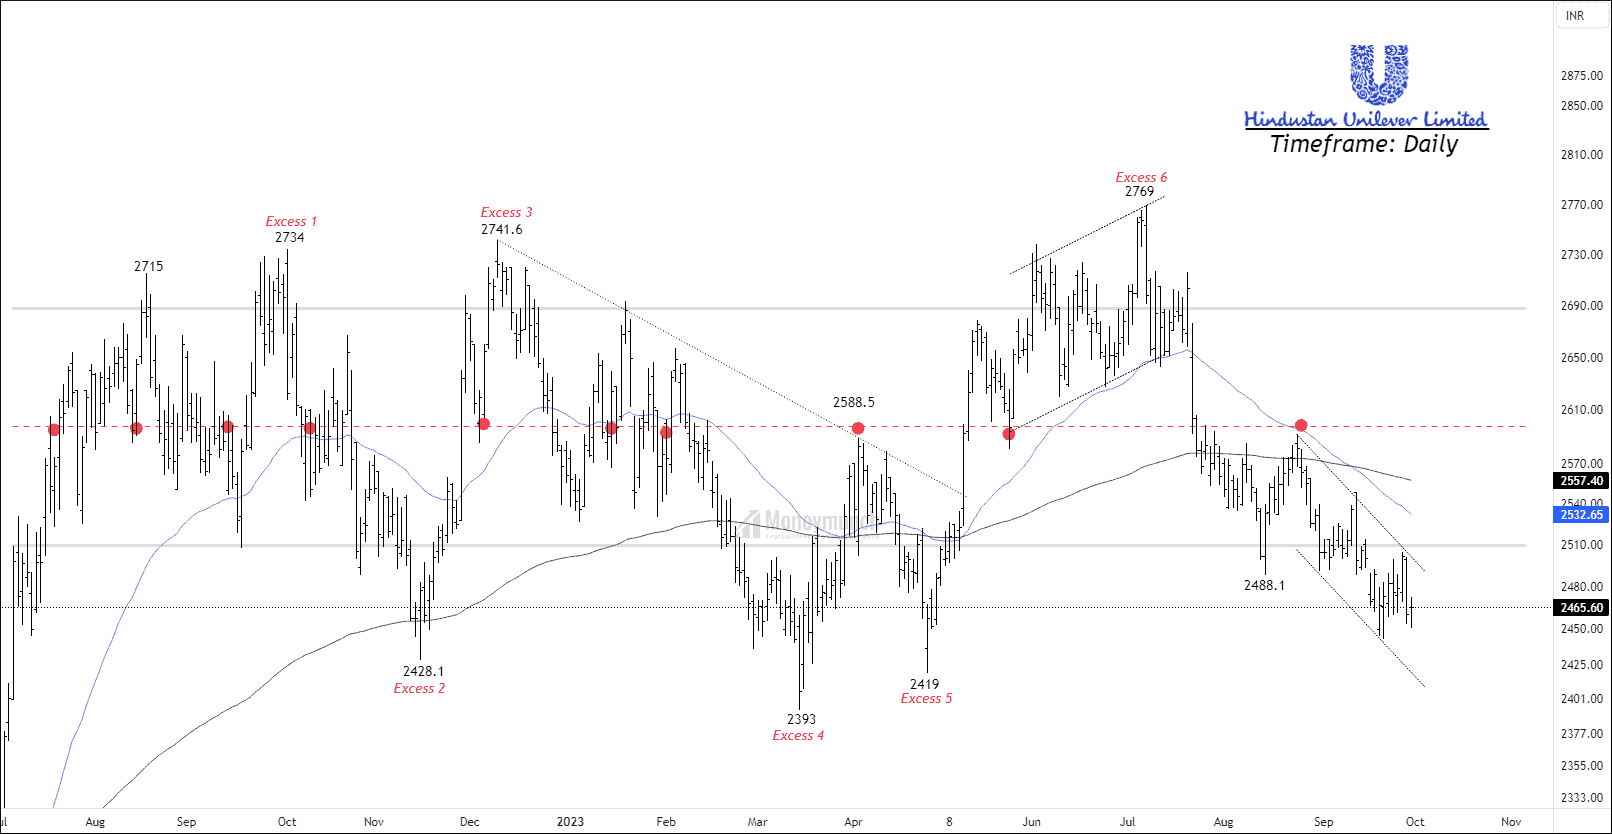
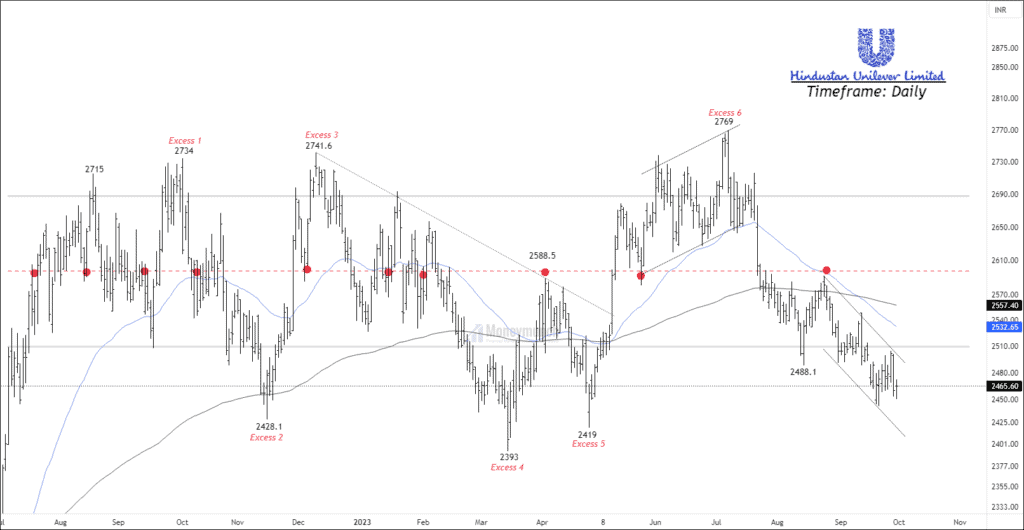
NSE HINDUNILVR has formed a corrective formation for more than 14 months on the daily timeframe chart. The price is trading below the 200 and 50 exponential moving averages. RSI of the price is 40.
The given structure has formed a value area in which there are a total of six excess on the upper and lower bands. The control line of the channel has nine touches on the control line. Also, note that the control line is the center point of volume activities. If the price sustains above the upper band of thevalue area, traders can trade for the following targets: 2550 – 2590 – 2645+.
We will update further information soon.
Get free important share market ideas on stocks & nifty tips chart setups, analysis for the upcoming session, and more by joining the below link: Stock Tips
Have you any questions/feedback about this article? Please leave your queries in the comment box for answers.
