Timeframe: Daily
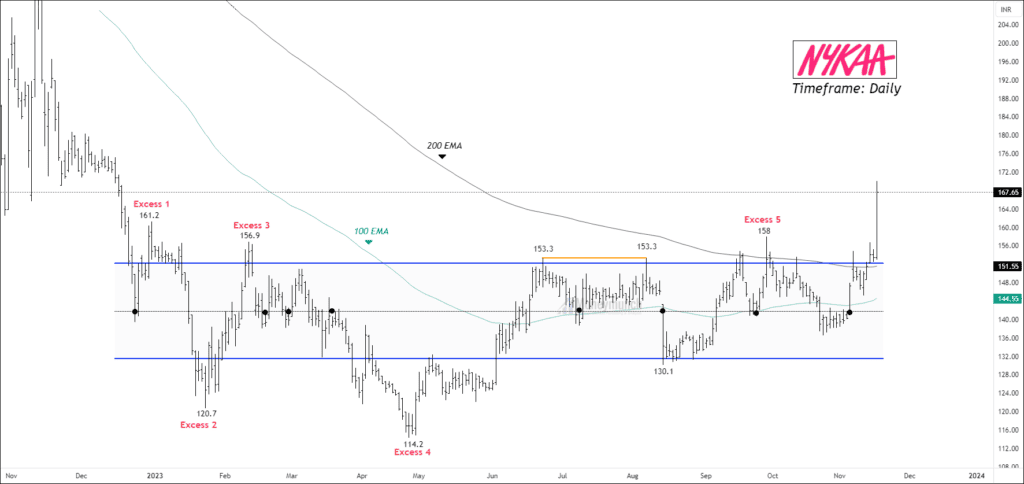
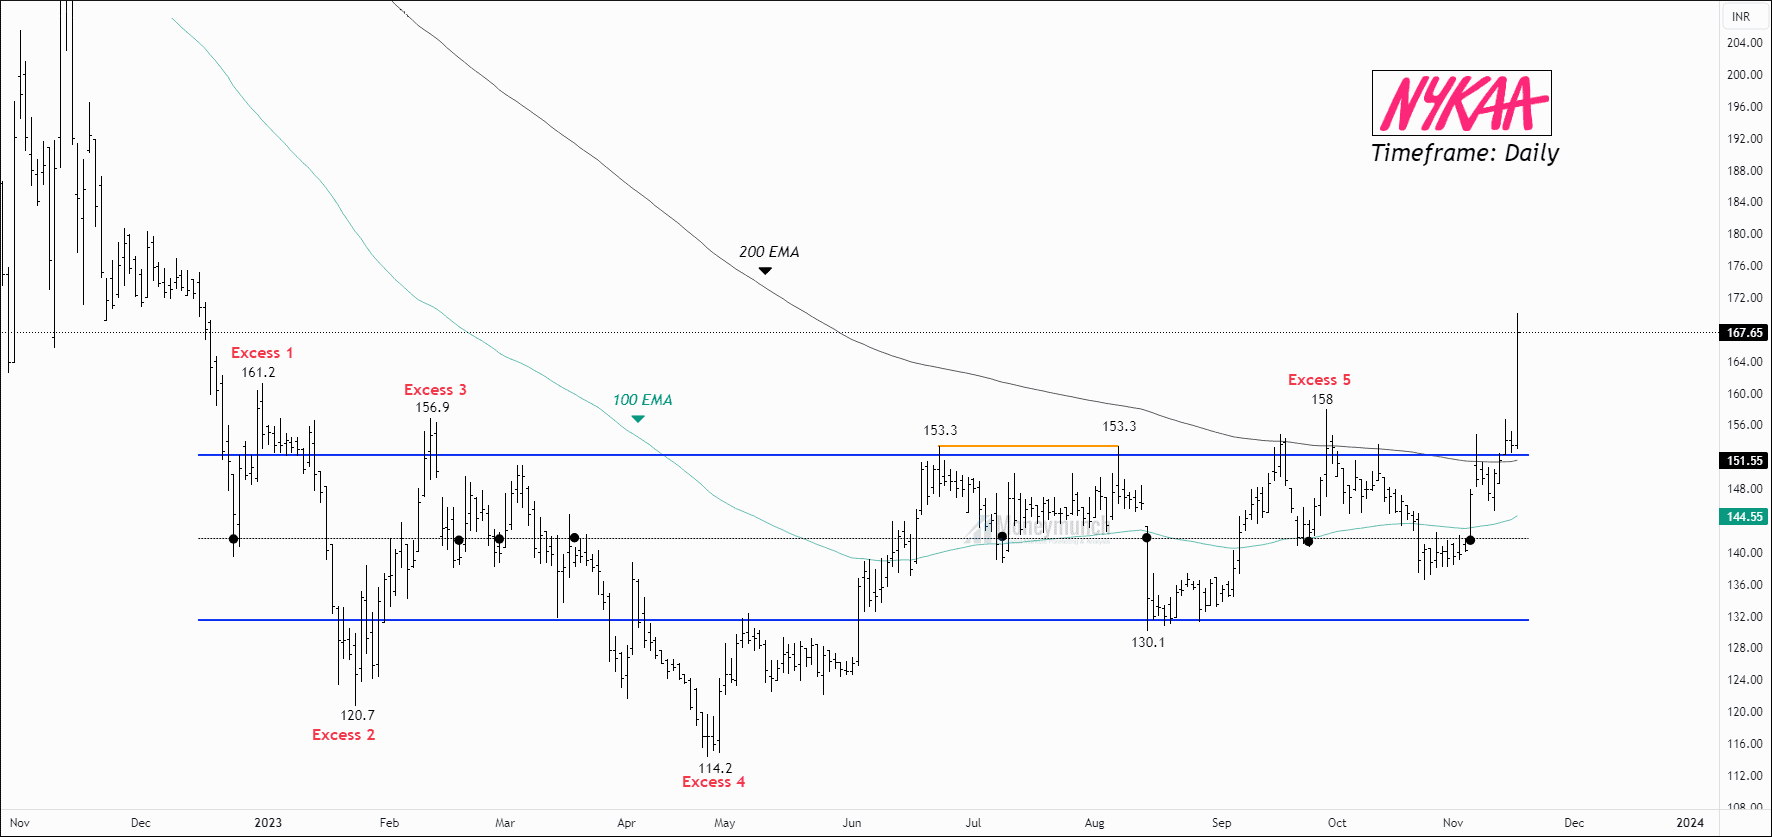
NYKAA had a notable jump in the last trading session, with its stock rising by 9.25%. This significant price rise may have resulted from profitable operations. Significantly, the stock showed a breakthrough above the 100-day and 200-day Exponential Moving Averages (EMA), indicating that the general trend may be changing. Additionally, the Relative Strength Index (RSI) peaked at 78, suggesting that the stock was overbought. The breakout of a 46-week consolidation pattern, indicated by a large candle, is another significant event. Strong fundamentals and these technical indications point to an optimistic attitude towards NYKAA in the market.
We will update further information for premium subscribers soon.
GIFT NIFTY – Elliott Wave Analysis
Timeframe: 4h
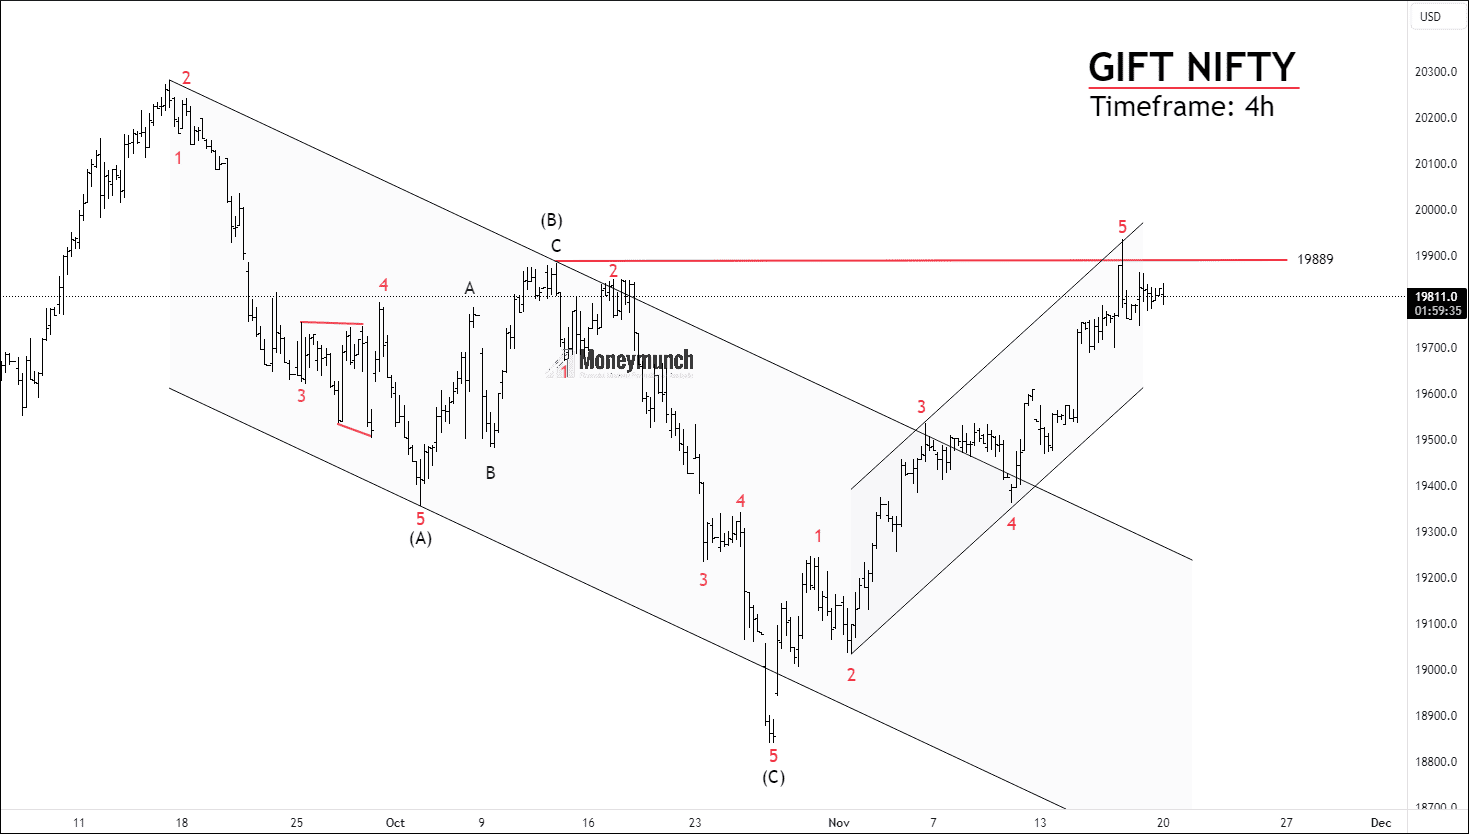
As per the daily chart, price has accomplished wave (C) of correction phase at 18840.5, and we can see a price surge. The rapid move has broken out sub-wave 4 of wave (c) indicates motive structure. Price has constructed 5th wave of the current structure that suggests the price can take a correction for wave 2/B if it rejects from the resistance point (B) at 19889. We can expect 38.2% Fibonacci retracement at 19500.
NIFTY FUT – Elliott Wave Perspective
Get free important share market ideas on stocks & nifty tips chart setups, analysis for the upcoming session, and more by joining the below link: Stock Tips
Have you any questions/feedback about this article? Please leave your queries in the comment box for answers.


 Lock
Lock
Thanks for sharing!
pls don’t stop your analysis, provide us daily nifty views
MARVELOUS!!!!!!