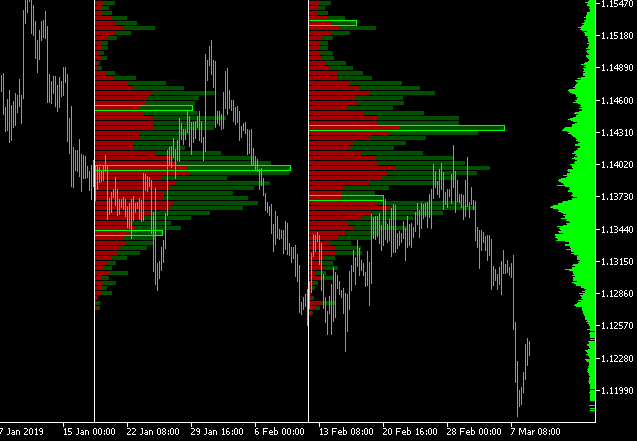
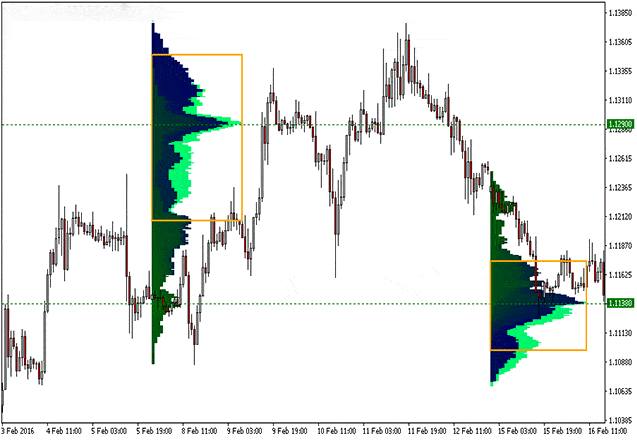
What is the volume profile indicator?
Volume profile is a charting feature that shows the traded volume amount of an asset, over a specified period at certain levels’ volume profile shows this data as a histogram in a y-axis next to price levels
Volume profile uses the past traded volume and all the strategies and plans are coming from historical data.
How are these volume profile bars created?
It takes total volume traded at a price, in a specific time period, and divides total buys and sell volumes and shows it on a histogram chart.
Traders can understand and use these volume profile indicators as the most powerful tools in their trading.
Different types of volume profile:There are three different types of volume profile. These types are not so much different in what they do. Their difference is how they show on your chart and the exact time period you want to see
Visible range(vpvr) volume profile visible tool that everyone uses it comes next to price level as a histogram Vpvr automatically shows the volume traded in the price level from the candles shown on the screen. If you charge or go back and forth in your price actions time period, the volume profile visible range will change
Fixed range volume profile fixed range is the exact same volume profile with a minor difference.
When you want to see the traded volume in a time period of price action such as an uptrend or downtrend, you can define the start and end point and see the volume profile only for that time period.
The benefits of using vpfr is that the volume profile Will not change by scrolling in the chart, and it always shows the traded volume in the price levels only for a selected amount vof candle.
Session volume (vpsv) Volume profile session volume shows the volume profile for all sessions shown on a chart.
You see a divided volume profile for each session presenting on the chart. Each session is considered a day, and it is the same with the change time period of the charts.
What is volume profile strategy?
The volume profile strategy is basically a study of the volume based on price. This is a bit different compared to the regular volume bars. This is then categorized into the buy volume or sell volume and makes this information available visually as it is plotted on a histogram on the y-axis.The longer horizontal volume bars are the ones of interest. These bars represent the price where there is the highest amount of volume.
Value area: The value area is basically the percentage of all the volume that is traded. The default setting for the market profile indicator is 70%. The value of 70% is based on the normal distribution curve.
Get free important share market ideas on stocks & nifty tips chart setups, analysis for the upcoming session, and more by joining the below link: Stock Tips
Have you any questions/feedback about this article? Please leave your queries in the comment box for answers.


perfect analysis i want to subscribe….. i have seen many of your analysis it is so perfect.
I’d like to get your subscription package
detailed overview and great chart. nice work!
My trading experience with grand capital has been great. I want to subscribed
Very true madam,
We have to Trade only after confirmation
Your chart quiz is great and the way you explain it to us is also great…
nicely expressed and really felt the same today
You’re doing a great job, and it looks like a lot more.
How you used the indicator in this chart
I am inspired by your chart and I want to take your subscription
The understanding of what you are saying about the chart is overwhelming