
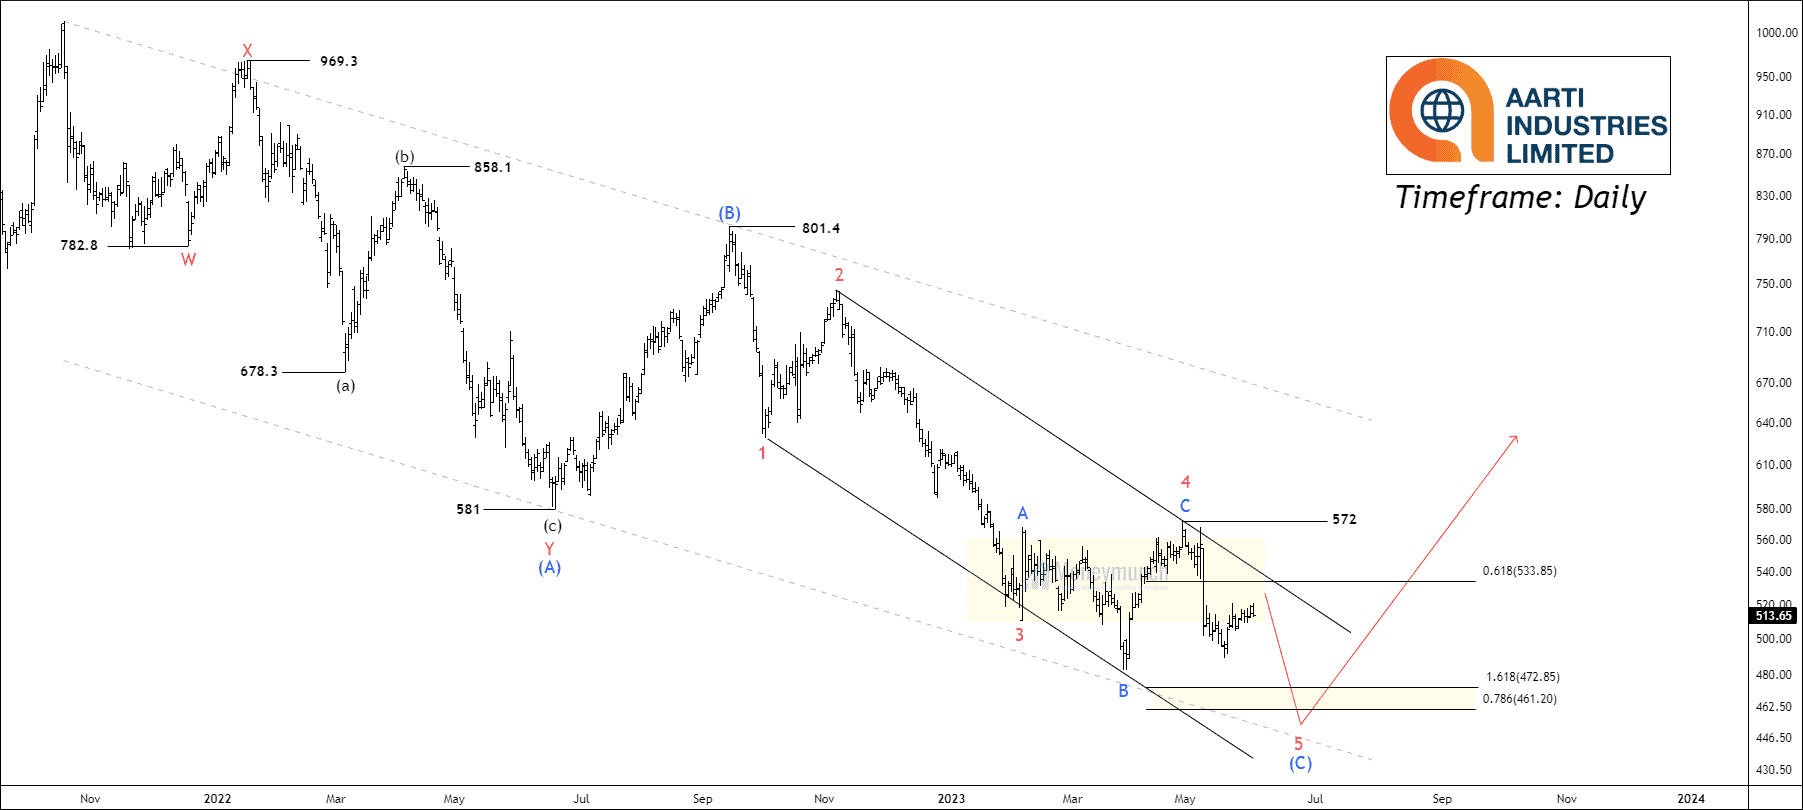
Timeframe: Daily
The stock of ARTIIND in the NSE has been going through a corrective phase for more than 81 weeks. The price reached a high of 801.4 and then started to decline in a corrective wave called (C), following a previous wave called (B). The initial wave, (A), consisted of 7 smaller waves forming a double zigzag pattern. Wave (B) retraced 50% of wave (A).
Analyzing the sub-waves within wave (C), it appears that the price has reached wave (4) at 572 and is currently declining in sub-wave 5. Based on Fibonacci analysis, wave (5) could occur within a range of 472 to 461. Wave (C) is expected to reach a level near 1.618% of the reverse Fibonacci retracement of wave (4) or 78.6% extension of wave (A).
According to the wave principle, a new trend can only begin after the breakout of wave (4) of a smaller degree. Traders can consider entering the trend after the price breaks out above 572, as this would indicate the start of the third wave in the new cycle.
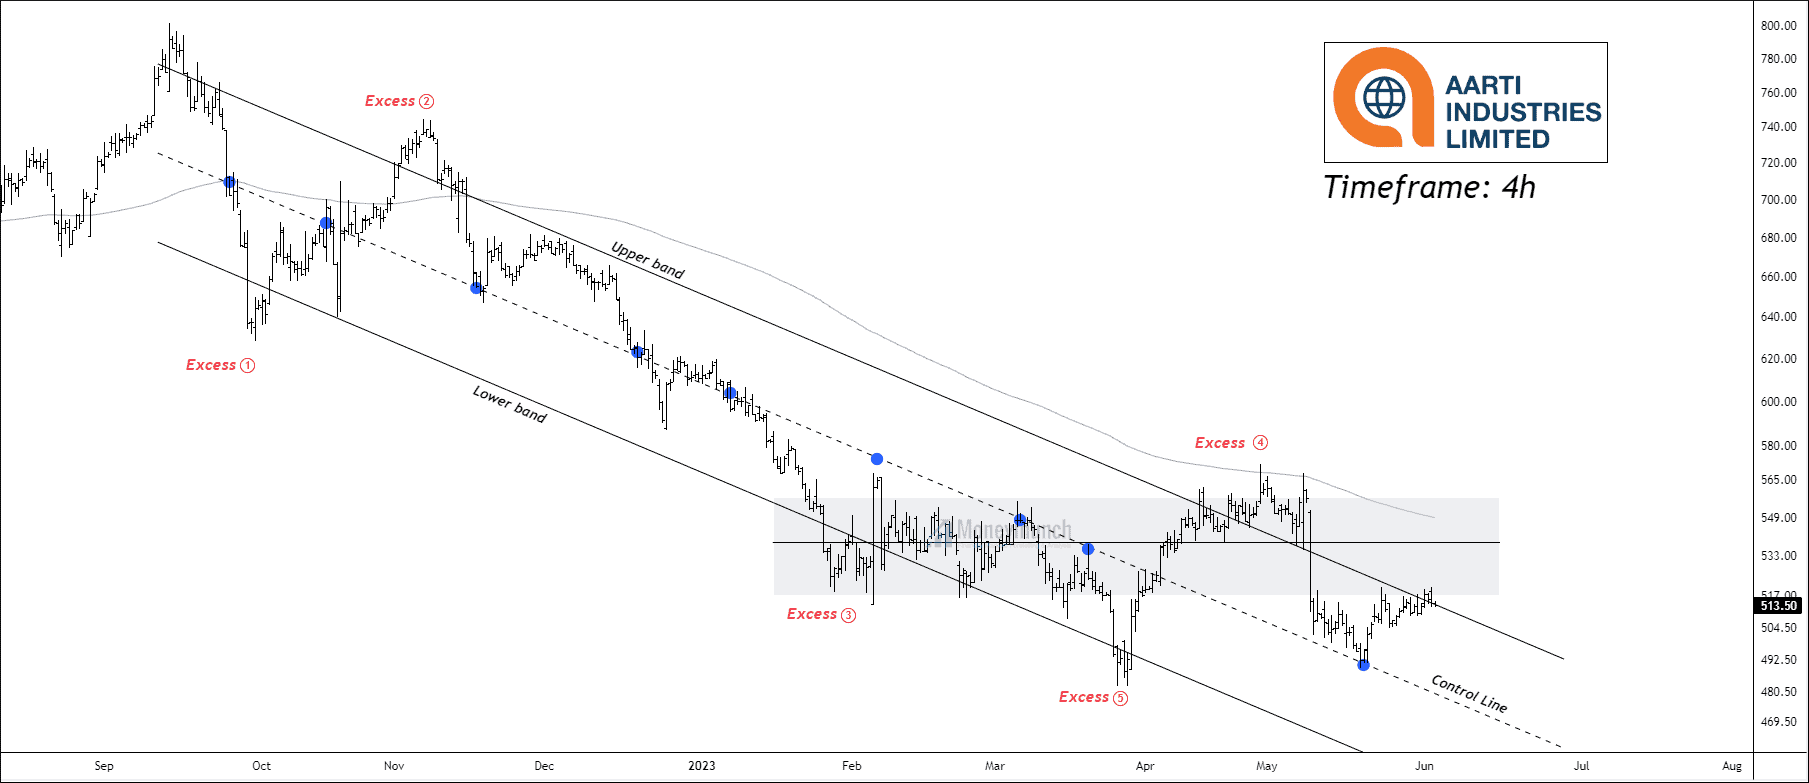
Timeframe: 4h
On the 4-hour timeframe chart, the price of NSE AARTIIND has created a downward trend, forming a value area. This indicates that the market is primarily moving lower. Additionally, the security is trading below the 200 EMA (Exponential Moving Average), suggesting that the bears are in control and preventing the bulls from reversing the trend.
In terms of price action, AARTIIND has shown two significant highs on the upper band and six instances of touching it. On the other hand, the lower band has experienced three significant lows and also six touches. The control line, which represents a price level that has influenced the movement multiple times, has been effective in directing the price action on nine occasions.
Within the descending value area, a sub-value area has emerged where the price has sharply declined. This indicates that buyers have been unable to respond effectively to the downward movement.
We will provide further updates soon.
NSE ABBOTT – Bullish Alert for Traders
On the daily timeframe chart, NSE ABBOTINDIA is displaying strong bullish momentum. In the previous trading session, the price experienced a significant breakout above both the 20-day and 50-day Exponential Moving Averages (EMA) accompanied by a large candle. The Relative Strength Index (RSI) has also risen to 54, indicating increased buying pressure. Additionally, the Average True Range (ATR) suggests that buying interest is present.
Furthermore, the stock has formed an engulfing pattern near the support zone of the moving averages. This pattern typically signifies a reversal of the previous downtrend. If the price manages to sustain above the level of 27730, traders may consider entering long positions with the following targets in mind: 21941 – 22214 – 22533+.It is advisable to consider the low of the previous session as the invalidation level for this trade setup.
NSE ASHOKLEY – Analyzing the Value Area Formation
NSE ASHOKLEY is currently trading within a significant value area ranging from 147.2 to 144.4. This price range holds particular importance as it aligns closely with the 200 EMA (Exponential Moving Average).
Should the price break below the lower band at 144.4, traders may consider selling with the following target levels in mind: 142 – 139 – 136+. Traders should use the upper band as the invalidation level for this trade setup.
On the other hand, if the price breaks above the upper band at 147.22, traders may consider buying with the following target levels: 149.7 – 153.5 – 156.4+. Traders should use the lower band as the invalidation level.
We will update further information soon.
Get free important share market ideas on stocks & nifty tips chart setups, analysis for the upcoming session, and more by joining the below link: Stock Tips
Have you any questions/feedback about this article? Please leave your queries in the comment box for answers.
Great work
Impressive analysis on Ashok Leyland! Your focus on the value area and its relation to the 200 EMA shows a strong understanding of key support and resistance levels. The outlined targets and invalidation levels are valuable tools for traders looking to capitalize on potential breakouts
Well-analyzed report for AARTIIND
Good presented analysis on Ashok Leyland