Intraday trade setup for spot nifty free

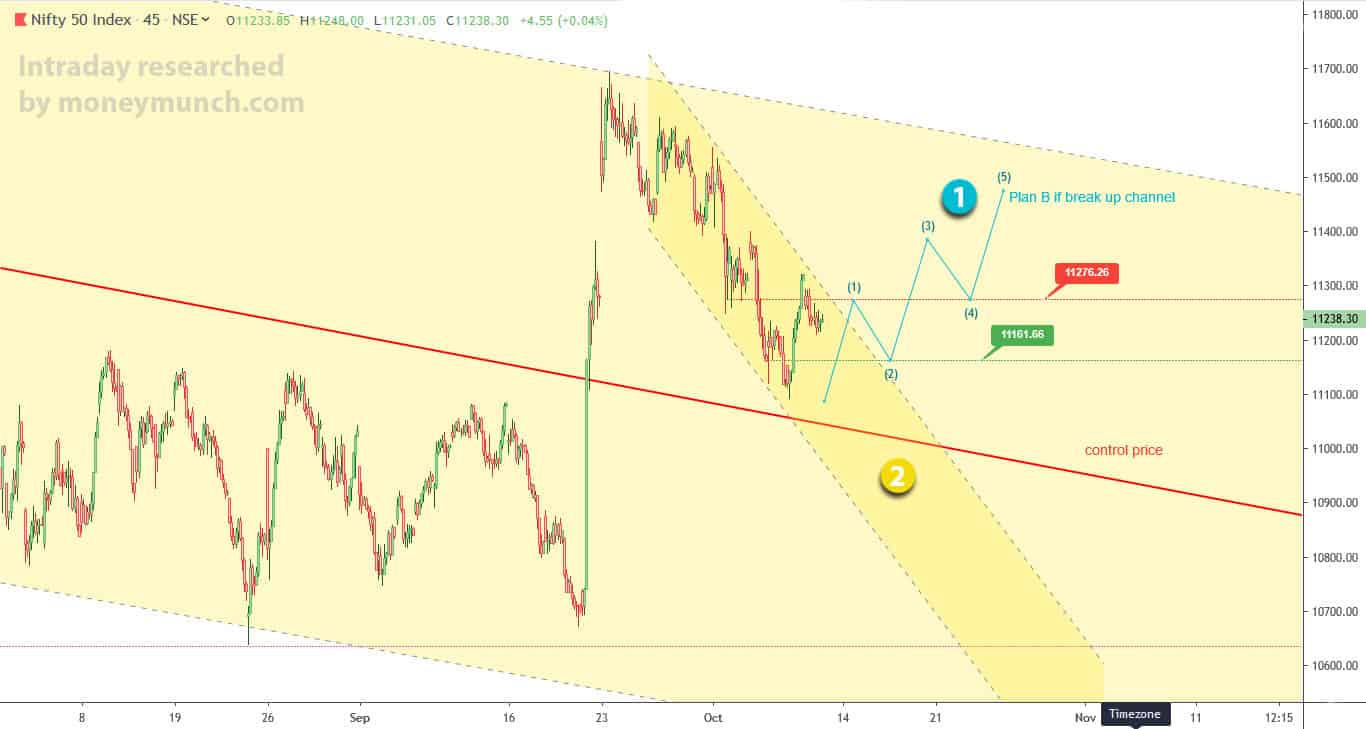
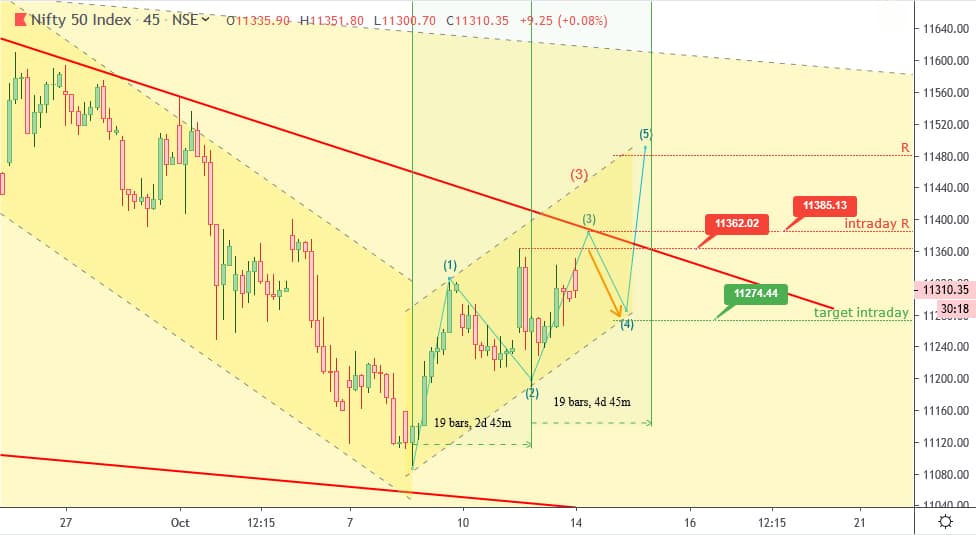
As per pullback wave predicted wave, Nifty intraday resistance 11385 and target for wave (4) at 11275 nearby.

As per previous high is also intraday resistance 11362.

Best trade is to short against informed traders 11375-11385 with little higher stoploss and target 11285-11265

3rd wave is not actually clear, therefore we have mentioned in 2 points of it.

above all level for spot nifty, future level for actual trade for subscribers as per below.

To become a subscriber, subscribe to our free newsletter services. Our service is free for all.

Continue reading

Intraday two trade setup plan for NIFTY

PLAN A (trade in channel) : Intraday Resistance 11287-96 for nominal target 11144 nearby and final channel target 11052

PLAN B (after breaking channel): Long side for subscribers only

Note: above all levels are for spot nifty, nifty future levels will for subscribers only

Below levels are for short selling

nifty, still weak after little bubble…
trade setup again for short side
Short  11370 with stoploss 11390 and with target 11266-11222 intraday

To become a subscriber, subscribe to our free newsletter services. Our service is free for all.

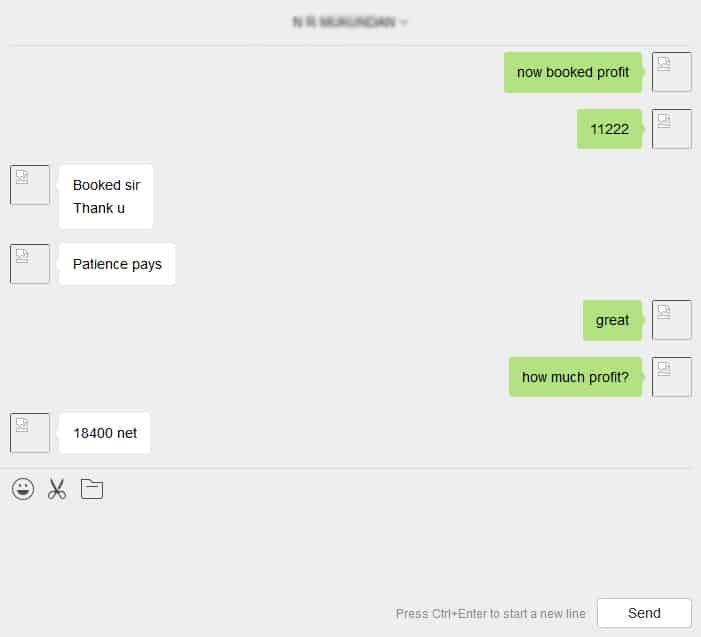
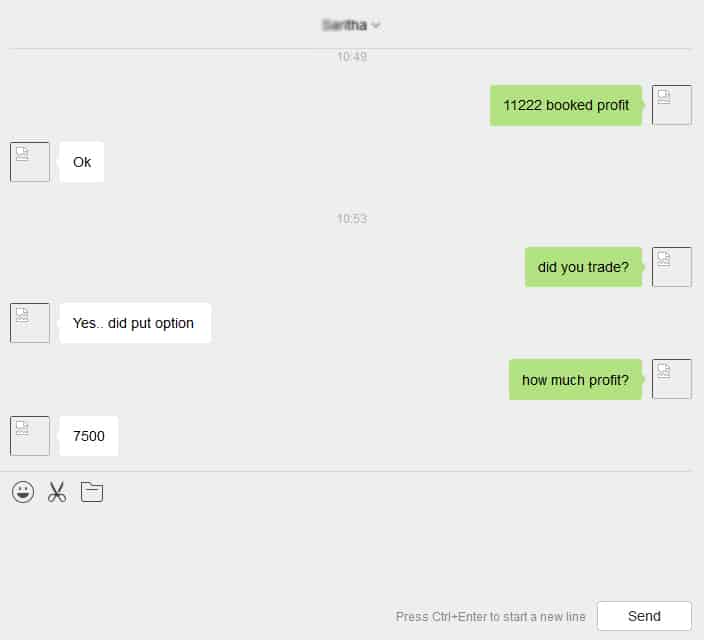
Subscribers’ chat with trade on short NIFTY as above short call

Subscriber 1 (chat)

Subscriber 2 (chat)

Continue reading

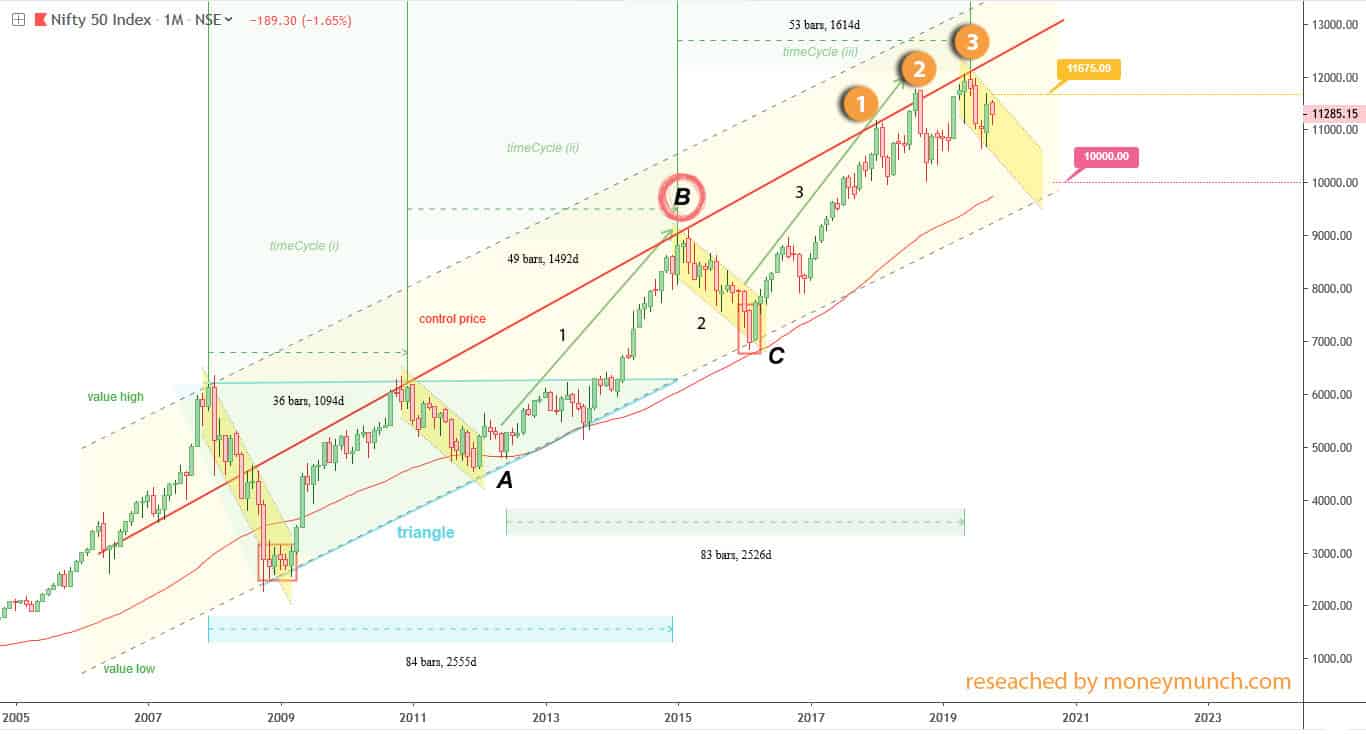
This chart is illustrates how nifty responses to significant investors

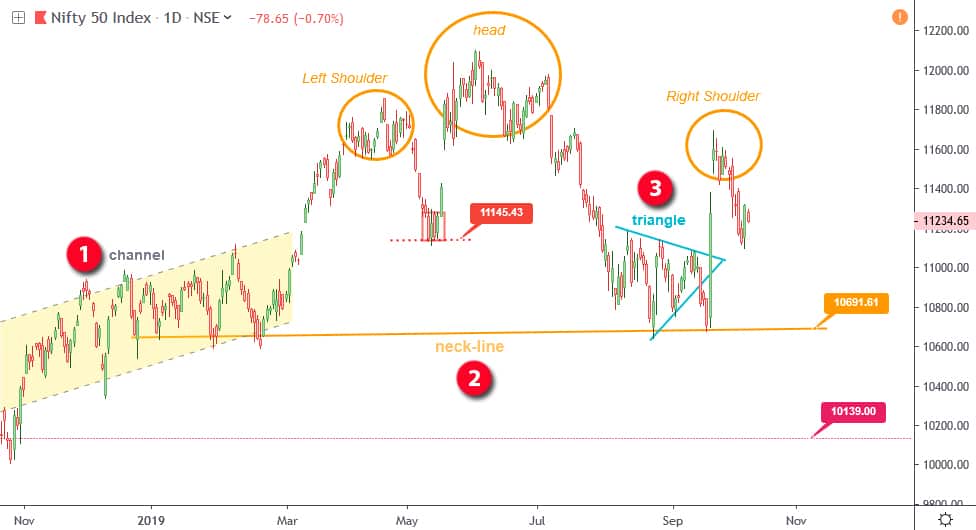
This chart is illustrates how nifty responses to significant investors. There are flag patterns, triangle and clear channel.

The “Control Price” tries to gravitate nifty value towards itself since 2007. Looking by attention, its was 3rd times to touch “control price” but eventually failed to cross it.

As per timeCycle and falling wave, nifty should not cross 11675 above if next target is 10000 nearby.

Let think oppositely, If nifty is going to toward control price again at 12400 above, it will cross and close 11675 level.

Option trade can boost your pocket (4x to 9x)

  • Head and Shoulder Pattern
  • Channel
  • Triangle

3 Pattern is found on daily chart and negativeness on nifty are still existed.

Look closely downtrend channel

Deeper picture of next nifty move projection with channel on daily chart.

Yes, at certain time your entry and exist action can increase your portfolio by three to five times (3x to 5x earning plan). Option trade can boost your pocket. More detail for subscribers…

To become a subscriber, subscribe to our free newsletter services. Our service is free for all.

Continue reading

Chart the weekly data for the NIFTY for the 2010 through 2015

Chart the weekly data for the NIFTY for the 2010 through 2015 time period and was obtained following patterns;

  • Triangle pattern
  • Parallel Channel
  • Breakdown strategy
  • Flag pattern
  • Head and Shoulders Pattern
  • Downward channel

We can easily understand the uptrend, downtrend, or sideways trend during that time. These all pattern are repeating time to time. We can also identify them while trading. Short-term traders sometimes practice what is called event trading. This is when either a news announcement is due, a surprise news announcement occurs, or a holiday is soon to occur. Holidays are seasonal, We will update soon very deepest research for identify future developing patterns.

Charts reflect market behavior that is subject to certain repetitive patterns. Given sufficient experience, some traders will uncover an innate ability to use charts successfully as a method of anticipating price moves.

Some analysts are now using pattern-recognition systems and other sophisticated computerized methods, and early results have demonstrated that, indeed, many of the traditional chart patterns have some predictive value. Charts have other uses, however, if only to quickly observe the history of prices. The benefits of chart use outweigh the problems associated with their interpretation.

To become a subscriber, subscribe to our free newsletter services. Our service is free for all.
Continue reading

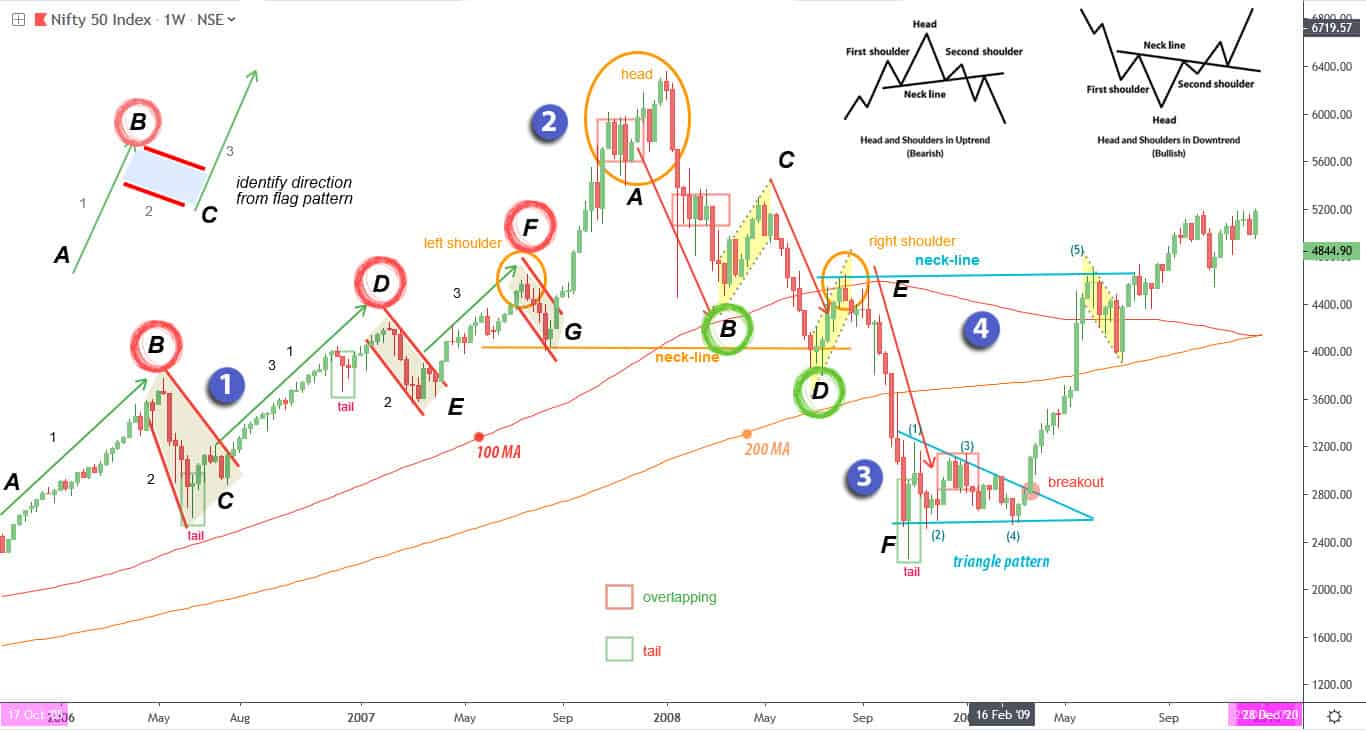
Technical Chart patterns on nifty data of 2005 to 2010

Following patterns are found for data of 2005 to 2010 (5 years data) on weekly candle chart.

  • Flag Patterns
  • Bullish and bearishHead and Shoulders pattern
  • Triangle Pattern

Patterns are repeating and again. Price Rotation, Overlapping, Tails etc are using for entry, exit and protective stop.

To become a subscriber, subscribe to our free newsletter services. Our service is free for all.

Continue reading

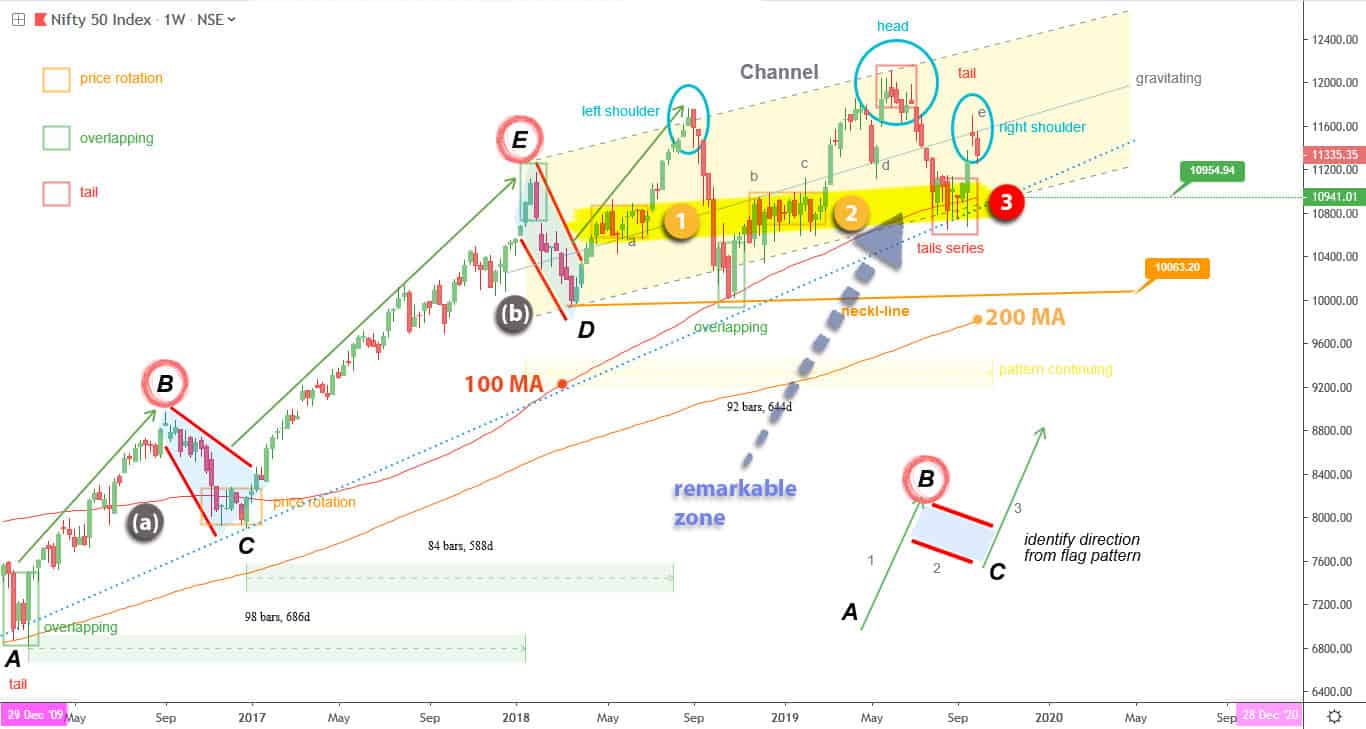
Chart Patterns for NIFTY, data of 2015 to 2020 weekly candles

Following patterns are found for data of 2015 to 2019 (5 years data) on weekly candle chart.

  • Channel pattern
  • Flag Patterns
  • Currently running Head and Shoulders pattern
  • Remarkable zone 1, 2 and 3

Head & Shoulders pattern is still uncompleted with right shoulder. The neckline target is 10063
At the remarkable zone, it has highly priced rotation detected with tails
As per channel pattern, the range is 12600 to 10900. The gravitating target 12000 for nifty.

Conclusion, break 10900 below nifty can draw more downward.

To become a subscriber, subscribe to our free newsletter services. Our service is free for all.

Continue reading