Unlock This Article
Only subscribers can read the full article. Please login to read the entire article.
NSE NIFTY Trade Setup For Subscribers
To become a subscriber, subscribe to our free newsletter services. Our service is free for all.Continue reading
Looking for reliable and free stock tips? Look no further than Moneymunch! We provide intraday and positional trading calls, technical analysis, research reports, and daily or weekly charts to help you make informed trading decisions in the stock market. Subscribe now and stay ahead of the game!
Did you read NSE TITAN’s research report?
Click Here: NSE NIFTY, TITAN & DALBHARAT Wave Analysis
 Continue reading
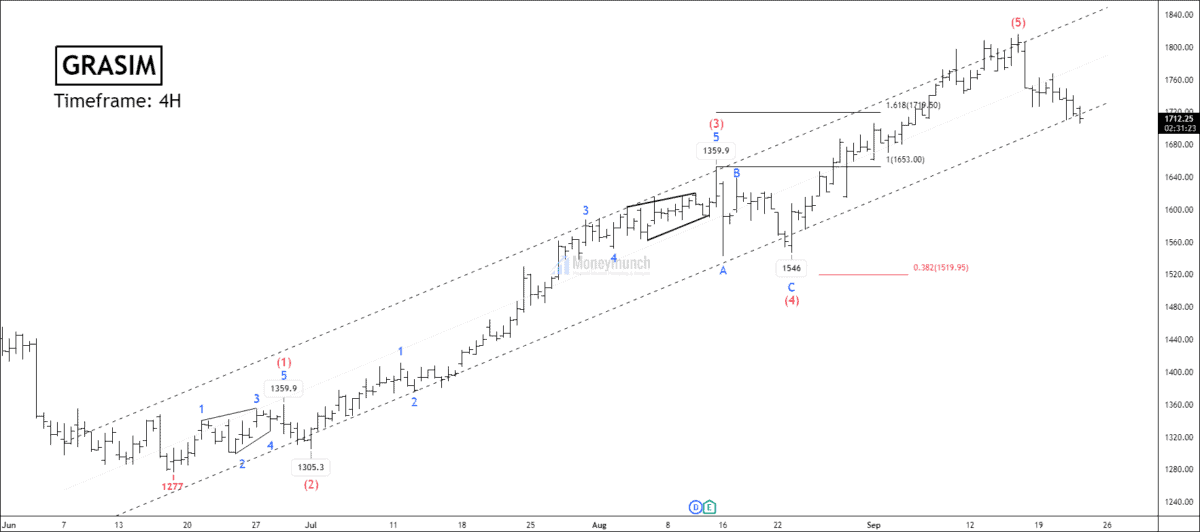
Do you remember Elliott wave analysis of NSE GRASIM?
Click here: NSE GRASIM: Elliott Wave Projection
 BEFORE
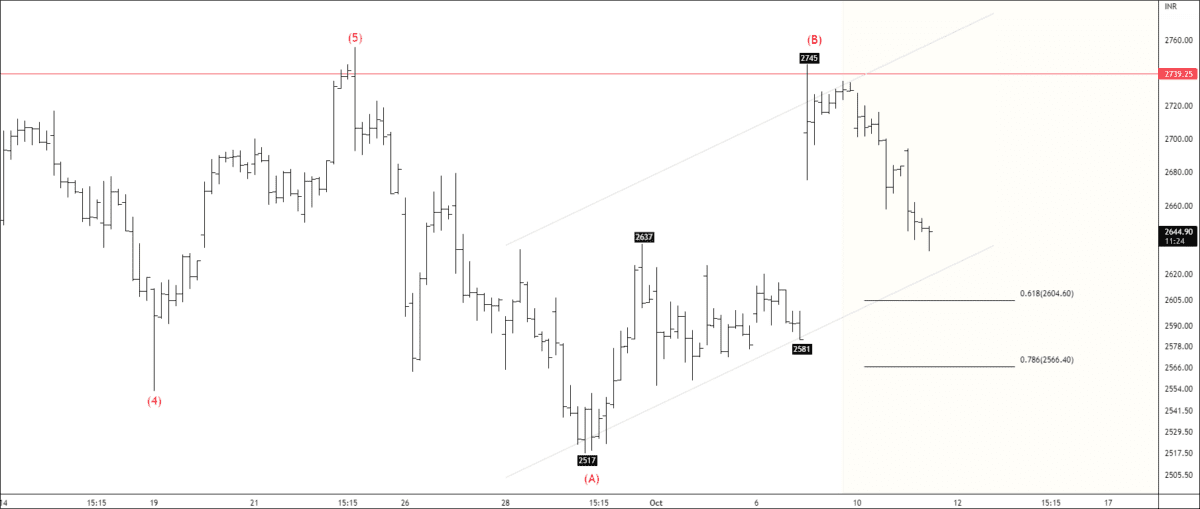
NSE NIFTY – Swing Setup For Subscribers