
What had I said about USDJPY @ September 18, 2017, 1:26 am.
USDJPY technical pattern is indicating bullish sign.
We are recommending all of our subscribers to wait for time to crossover 111.432 level. After close above or crossover, you will see 114.075 level.
Keep in mind, USDJPY index STOCH(9,6) indicating bearish pattern 110.265-109.499-109.104 levels.
Clear Sell Signals for USDJPY Traders.
USDJPY waves targeting trading line, you can see 113.298-113.052 levels.

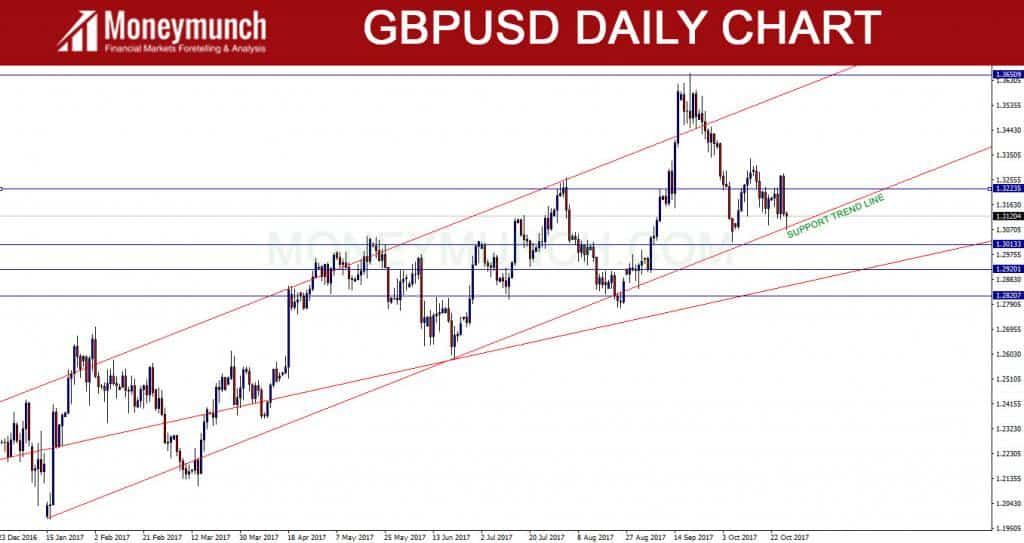
Follow our chart; you will expect 1.32235-1.36509 levels.
GBPUSD crossover or close below support trend line. Then you will definitely see 1.30133-1.29201-1.28207 levels.

EURUSD technical pattern suggest bearish trend.
Just Keep in Mind those levels: 1.15071-1.13849-1.13203.

For smart traders find your position in the chart.
Only for our premium subscribers.
 Unlock This Article
For more Updates and Exact entry and exit, levels subscribe our Services.
Get free forex & currency ideas, chart setups, and analysis for the upcoming session: Forex Signals →
Want to get premium trading alerts on GBPUSD, EURUSD, USDINR, XAUUSD, etc., and unlimited access to Moneymunch? Join today and start potentially multiplying your net worth: Premium Forex Signals
Premium features: daily updates, full access to the Moneymunch #1 Rank List, Research Reports, Premium screens, and much more. You΄ll quickly identify which commodities to buy, which to sell, and target today΄s hottest industries.
Have you any questions/feedback about this article? Please leave your queries in the comment box for answers.