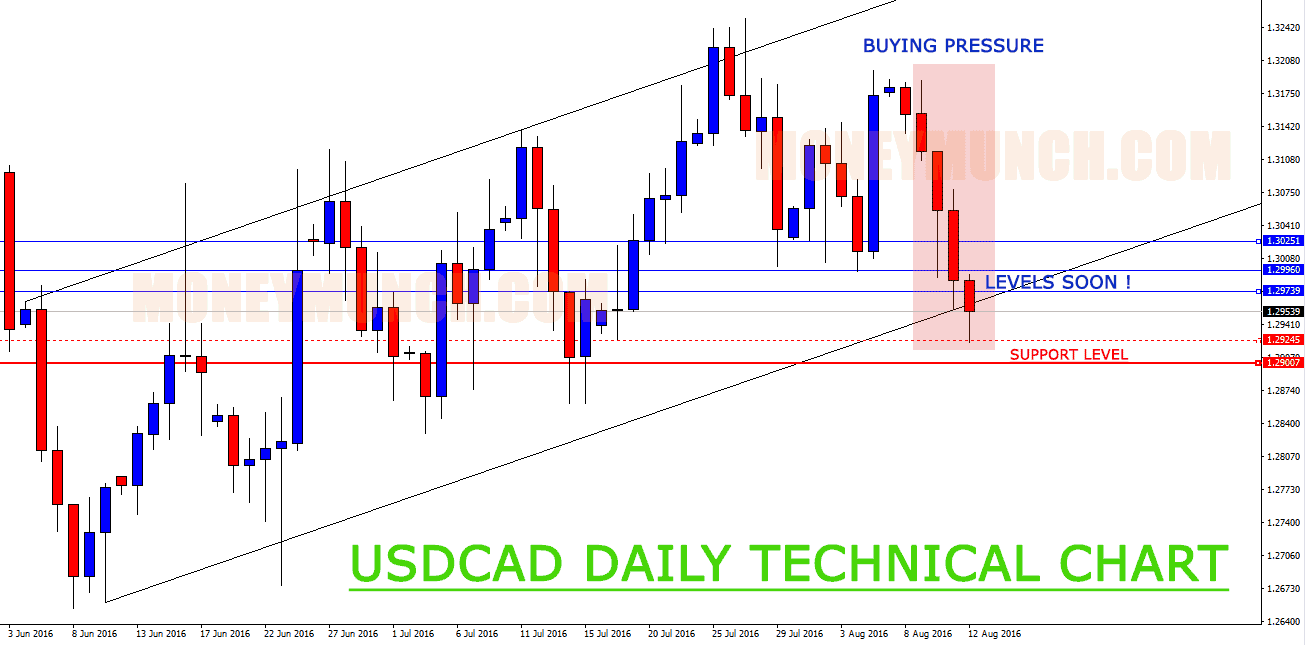
UPDATE ON GBPUSD AND USDCAD

UPDATE ON GBPUSD TECHNICAL ANALYSIS

Did you miss GBPUSD Elliott wave analysis report? Don’t worry click here.
Before market open, what I had written about GBPUSD

“GBPUSD follow basic Elliott wave structure, you can see 1.32125-131898 levels soon. You may buy at 1.31898 or below levels, it will raise up to 1.32581-1.32888 levels.”

You can see GBPUSD eat both targets (1.32125-1.31898 levels).

UPDATE ON USDCAD TECHNICAL ANALYSIS

usdcad elliott wave analysis

USDCAD follow Elliott wave method, you can see USDCAD raise up to 1.31408-1.31858 levels. It’s a strong seller area.
An invalidation level is at 1.32514, break above this level would invalidate the count.
For more Free Elliott wave method and technical analysis reports, subscribe to our daily newsletter services.

Continue reading

FREE FOREX TIPS ON GBPUSD, USDJPY, USDCAD AND EURUSD

Elliott wave anlaysis on GBPUSD

FREE ELLIOTT WAVE ANALYSIS ON GBPUSD

GBPUSD follow basic Elliott wave structure, you can see 1.32125-131898 levels soon. You may buy at 1.31898 or below levels, it will raise up to 1.32581-1.32888 levels.
An invalidation level is at 1.32993, break above this level would invalidate the count.

USDJPY signals for long-term traders

Its reversal time in USDJPY for Long-term traders!
USDJPY is generating massive buying pressure. Smart traders should buy USDJPY at the support level(it will U-turn from 100.525 level).

USDCAD falling signals

USDCAD is indicating strongly down signals in RSI, MACD, and Stochastic. You will see 1.29978 level in a few hours. Additionally, it will also hit strong support level 1.29434 soon.
Keep in mind if it is a crossover or close above 1.30752 level then you can see up to 1.31408 level.

EURUSD Technical analysis

BE ALERT FOR EURUSD TRADERS!
EURUSD is indicating neutral signals. You will see pricing moves patterns between 1.11963-1.11057 levels and make a triangle.

Continue reading

Forex Signals: USD/CAD – Ready To Break Downtrend

USDCAD is for lion heart daily traders. You can earn a bunch of dollars in a night but if you know where to pick! Yesterday it had dropped a lot and today USDCAD is continue falling. It’s time for recovery. Smart traders for support: 1.29105 levels. You must buy it above (anywhere) the support level. It will shortly hit 1.30150 – 1.31330 levels.

If this currency breaks and close below to the support then you may see downfall up to 1.28450 levels.

Continue reading

FREE Forex & Indian Currency trading tips and signals on USDCAD & GPBINR

free usdcad live sell signals

Above chart is explaining everything, so now we don’t need to type more.
Targets: 1.28654 – 1.28394 – 1.28212

GBPINR Trading Tips & Forecasts

On last week this currency dropped -1.815 rupees. GBP INR will continue to drill downside. Day traders can sell anywhere for 89.2 – 88.8 levels. Be careful with positive opening bell and don’t forget to pick a perfect top for intraday short!

Continue reading

FREE Forex signals / forecasts on USDCAD, EURUSD & USDJPY

USDCAD charts with signals & tips

On above USD / CAD chart, you can see this pair is continuing falling since 17 Jan, but it had taken U-turn after hitting the support level (1.28355). I’d recommend buyers to stay in hold. On next week we may see 1.31300-1.33445 levels.

When should I sell USDCAD?
Level: 1.28175
Once USDCAD show closing below to above level or break that level, then you could sell it for 1.26030-1.23810.

EURUSD charts with forecasts & tips

Look at above chart, technically euro is looking weak against American dollar. Short term investors can start selling from Monday opening bell. It may show some up moves, but overall looking downward.

Targets: 1.13200-1.12100-1.11000

Keep note, if the EUR / USD will crossover resistance 1 then it may try to touch resistance 2 so be careful with it.

Long term target: 1.08600

USD JPY tips forecast

USDJPY is planning to take U-turn from Monday opening bell. It could show 111.22 levels, but it’s a trap for day traders. This week we will see 113 levels.

If you would like to dive for long term then 113 levels is best for sellers because USDJPY is overall down for big time.

For long term investors: once the USDJPY will be close below the 111.100 levels then we see 110.08-108.350-105.600 levels.

Continue reading

Forex signals & forecasts on GBPUSD, USDCAD and EURUSD

free signals gbpusd chart forecast

Look at the above chart, GBPUSD pair may fall Monday up to 1.4985 levels and after hitting the 1.4985 level it’ll try to move up and touch 1.50925-1.52065+ levels. Day traders should to keep in mind 1.49625 level. If GBPUSD pair breaks the 1.49625 level, then we will see 1.48075-1.47531-1.46303 below levels.

free signals usdcad chart forecast

USDCAD is strongly bullish for long term. If that close below to 1.27217 levels then downtrend will be being.

If USDCAD pair crosses and close above the 1.33478 levels then buy signal will be arisen with high volume, and later it’ll show us 1.34172-1.35000-1.35580+ levels.

On the above chart, I’ve mentioned 1.28583 levels. Short term buyers may see it shortly, so be careful before investing in this pair.

free signals eurusd charts

If the EURUSD pair breaks and closes below to 1.07167 levels then it will hit 1.05906-1.04676 levels OR if it not breaks that level then it’ll stay up for some time!

Continue reading