Weekly forecast report on USDCAD EURUSD USDJPY AND GBPUSD

UPDATE : USDCAD NEED CORRECTION REPORT

What had I written about USDCAD @ June 25, 2018, 12:43 am (IST)?click here.
We had strongly recommended,

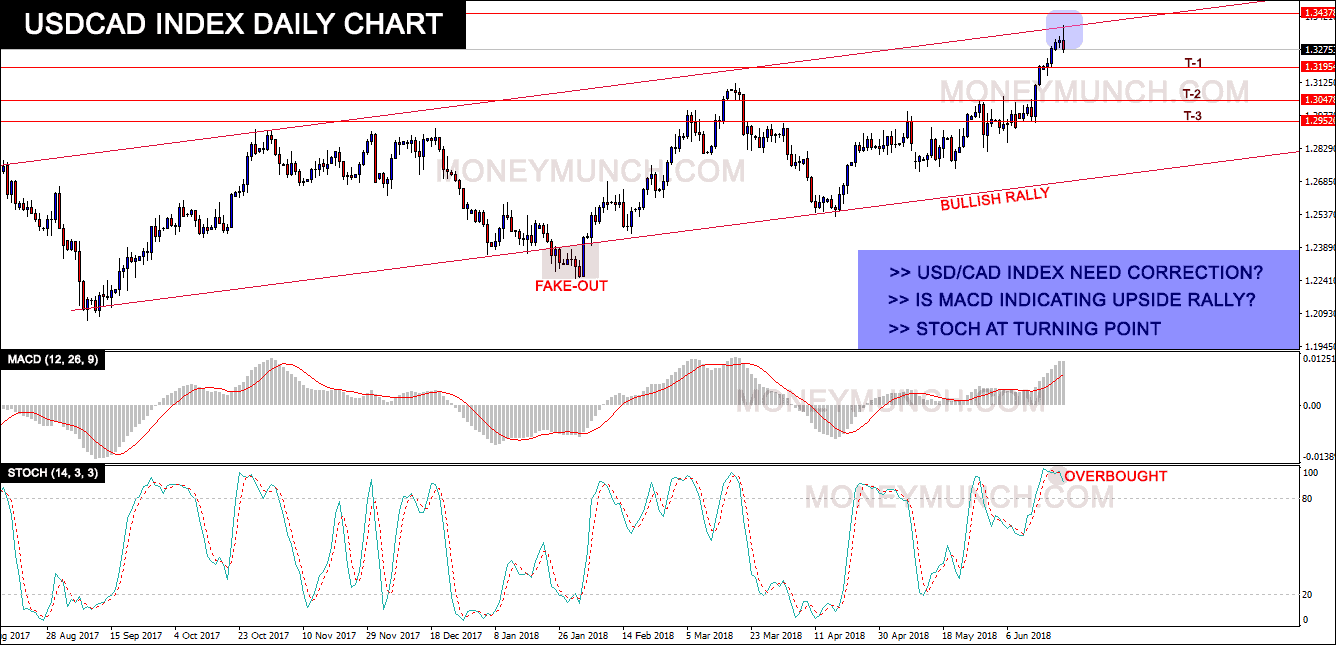
On USDCAD Index, 50% Correction awaiting ahead because it had overbought in the previous week.
The Technical Indicator STOCK (14, 14, 3, 3) is indicating sell signal on U.S. Dollar / Canadian Dollar pair. FX Traders could take profit at 1.31954 – 1.30478 – 1.29520 levels.
Its price can hike if USD CAD index crossover or close above the resistance level (1.34378), you can see the 1.35500 – 1.37788 levels.

USDCAD second target achieved 1.31954 – 1.30478 levels.

eurusd-forecast

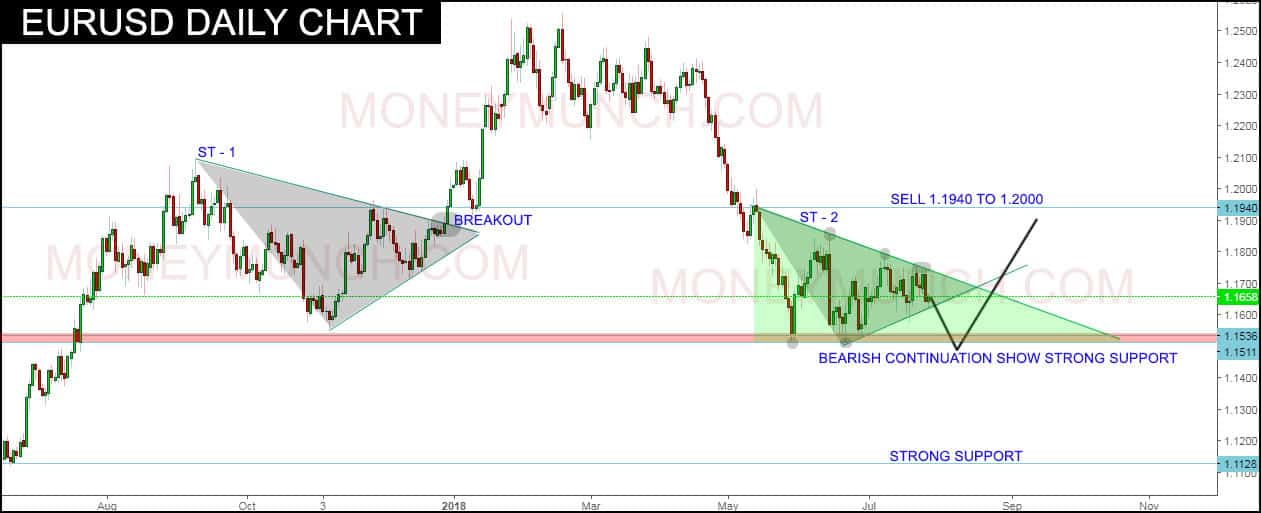
EURUSD: Bearish continuation?

Symmetrical triangle (ST) – 1: breakout shows high 1.2557 (16/02/2018).
Symmetrical triangle (ST) – 2: Bearish continuation?
We will update entry level only for our premium Subscribers.

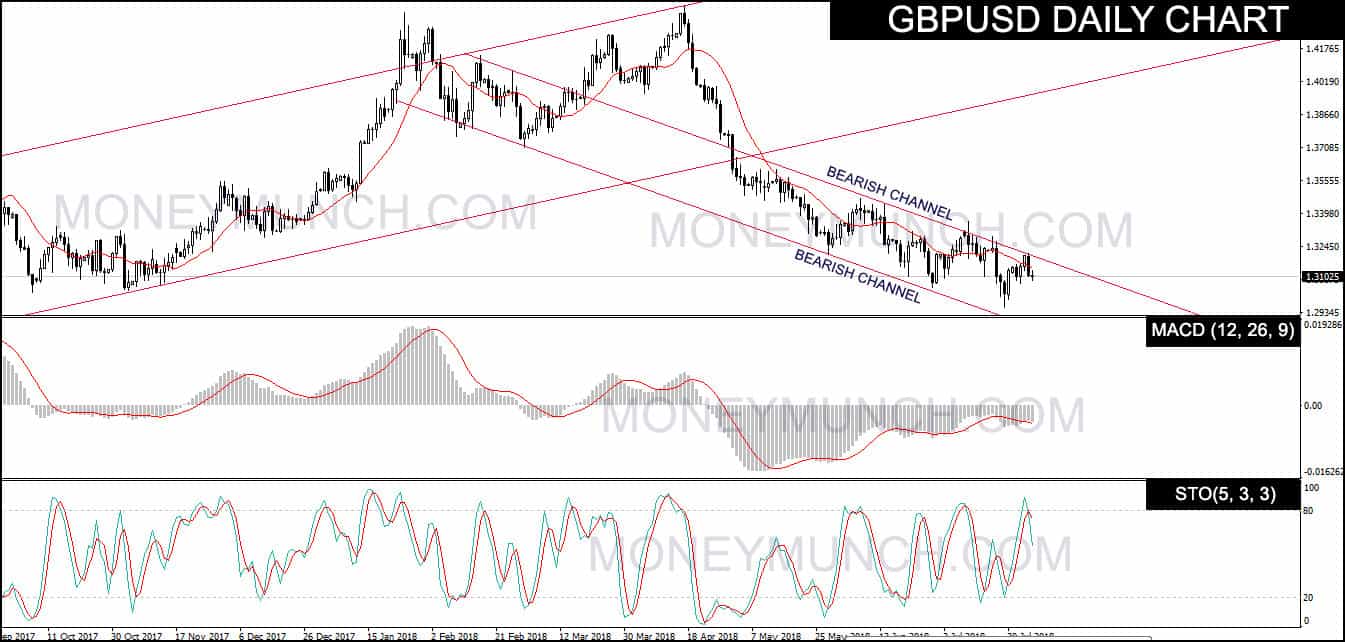
GBPUSD: Buyer fails to reattempt.

Our preference
Short positions below 1.30749 with targets at 1.30464 – 1.29835 – 1.29079 – 1.28406 in extension.
Alternative scenario
Above 1.30749 look for further upside with 1.31376 – 1.31999 levels

USDJPY : No Correction On USDJPY previous report

Follow the previous report of USDJPY, We will recommend buying after breakout of 111.489 level.

free forex tips on usdjpy
Continue reading

USDINR, USDCAD & EURUSD INDEX – Trading Signals

free-forex-usdinr-tips

Upside Risk for USDINR in 2018

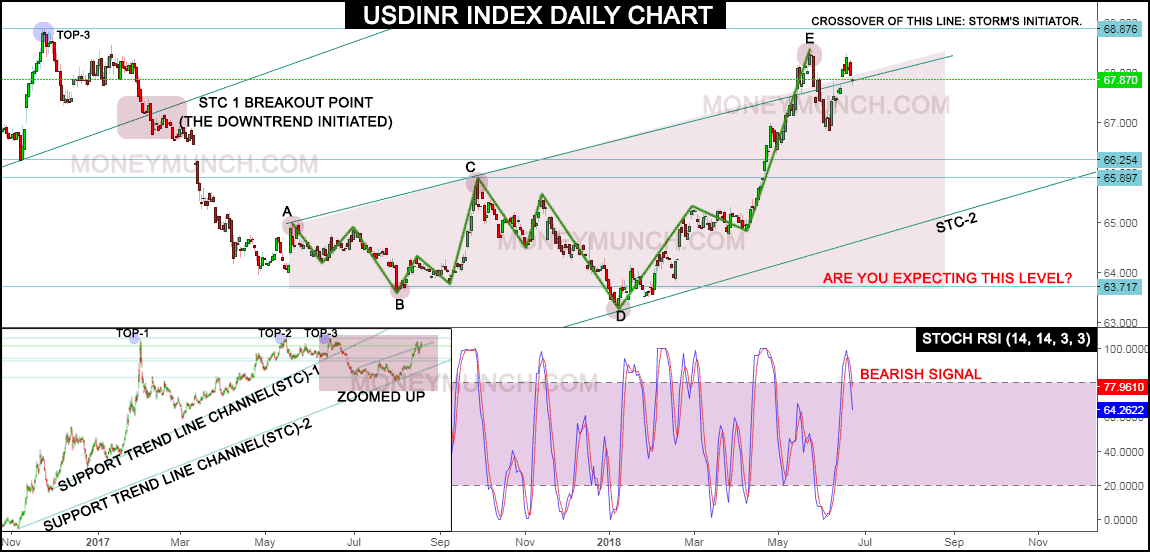
Support Trendline Channel 1 (2012 – 2017): A Solid Uptrend – It had been broken on May End

Support Trendline Channel 2 (2011 – 2018): Trying to Resume The Uptrend of STC 1

All Top Levels are Working as Strong Resistance. STC 2 is failed to hold uptrend as per Elliot Wave Signal.

As per EW, the upcoming target is 67.464 – 66.254 – 65.897 – 63.717 levels.

Caution: Top breakout can make this pair unstoppable upside. That’s why I named Strom’s Initiator on the above chart. We may see these levels: 69.450 – 70.291.

To become a subscriber, subscribe to our free newsletter services. Our service is free for all.

USDCAD NEED CORRECTION?

On USDCAD Index, 50% Correction awaiting ahead because it had overbought in the previous week.

The Technical Indicator STOCH (14, 14, 3, 3) is indicating sell signal on U.S. Dollar / Canadian Dollar pair. FX Traders could take profit at 1.31954 – 1.30478 – 1.29520 levels.

Its price can hike if USD CAD index crossover or close above the resistance level (1.34378), you can see the 1.35500 – 1.37788 levels.

Continue reading

Trading Strategies & Signals: USDINR, USDCAD, EURUSD & USDJPY.

USD/CAD: Analysis and Forecast for this week.

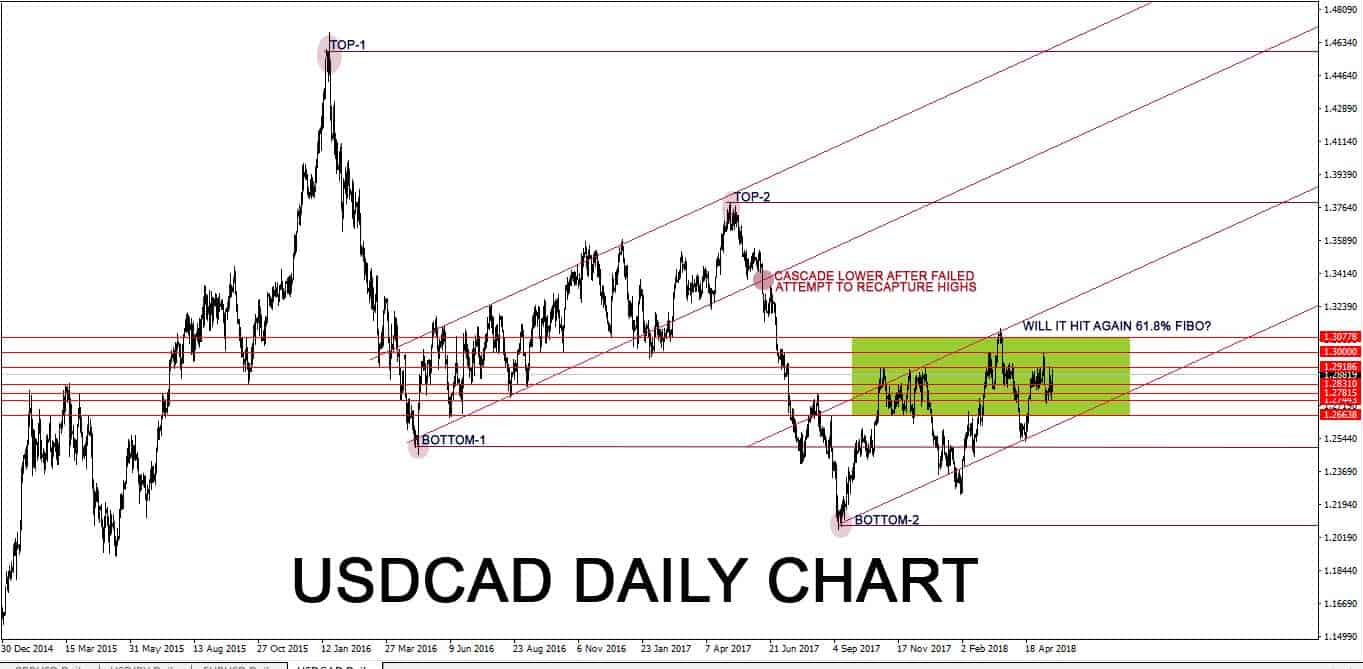
We will see Canadian Dollar is reaching 61.8% Fibonacci retracement in this week.

USDCAD is targeting 1.29186-1.30000-1.30778 level.

Support found at the 1.28310 level. If USDCAD crossover the support level, you can see 1.27815-1.27443-1.26638 levels.

Attention: USDINR is reforming to the top.

Crucial Level: 67.726

Targets: 68.244 – 68.553 – 68.876

The crucial level breakout can show 67.397 – 67.152 levels.

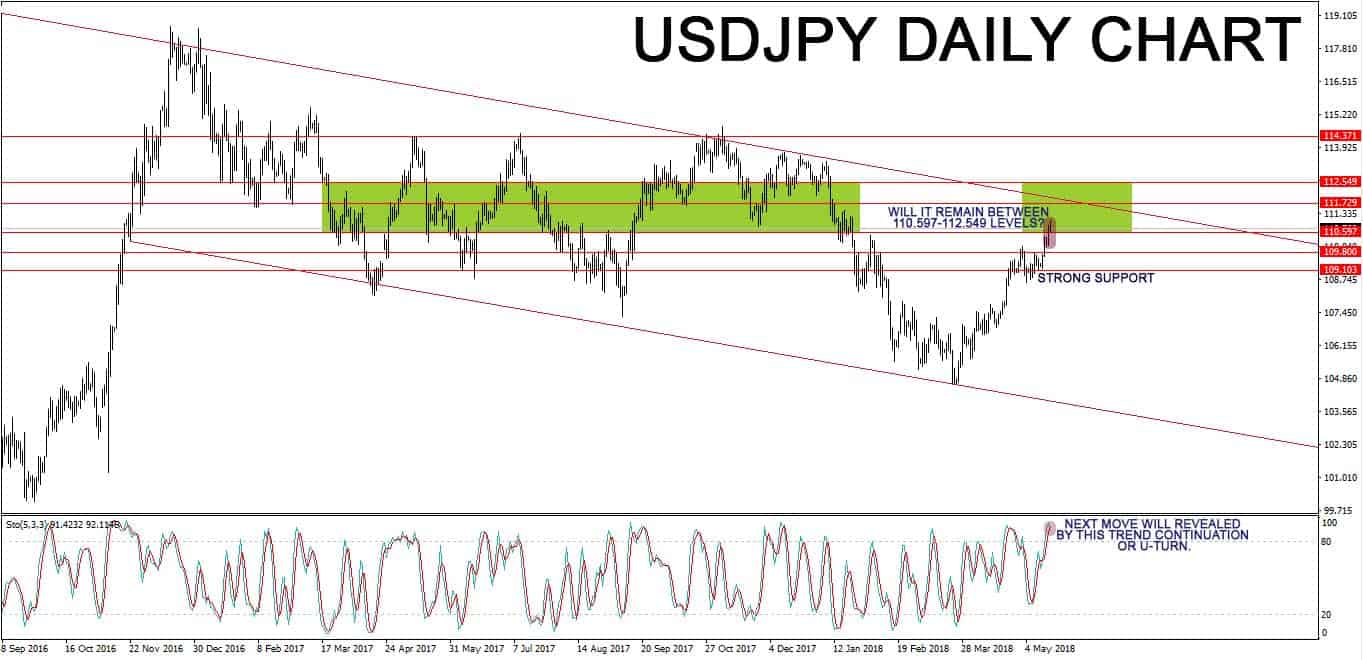
USDJPY is cooking something special for currency day traders. Be careful!

USDJPY will it remains between 110.597-112.549 levels?

What is indicating S.O.?

To know more, subscribe to our service.

Continue reading

FOREX SIGNALS : USDCHF, AUDUSD, USDJPY, EURUSD index

usdchf forex signals

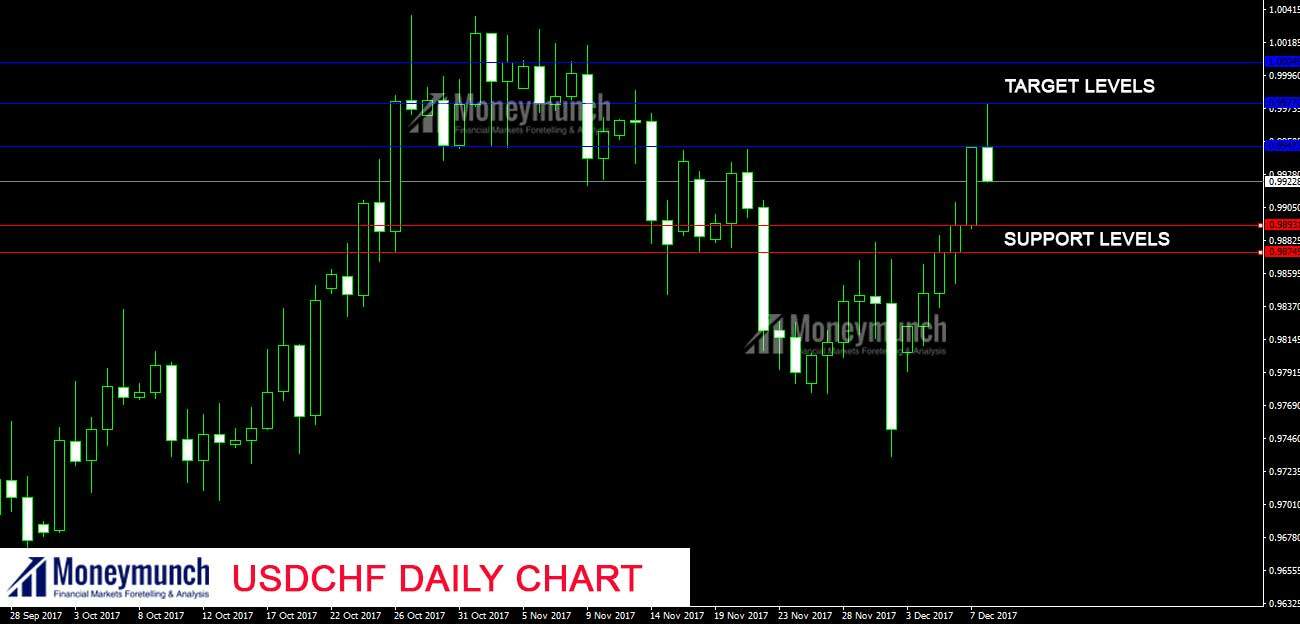
USDCHF need support for achieving high levels (1.00027-1.00281-1.00945), you will see 0.98931-0.98745 levels for support.
If USDCHF index is close below the support level, you will see 0.98131-0.97714 levels.

[ultimate_heading main_heading=”What will be the next move after buyer’s pressure on EURUSD index?” main_heading_color=”#dd3333″ alignment=”left” main_heading_font_family=”font_family:Raleway|font_call:Raleway” main_heading_font_size=”desktop:32px;” margin_design_tab_text=””]Only for our premium subscribers.[/ultimate_heading]
Continue reading

Forex Signals : BTCUSD, USDJPY & EURUSD INDEX

USDJPY FOREX SIGNALS

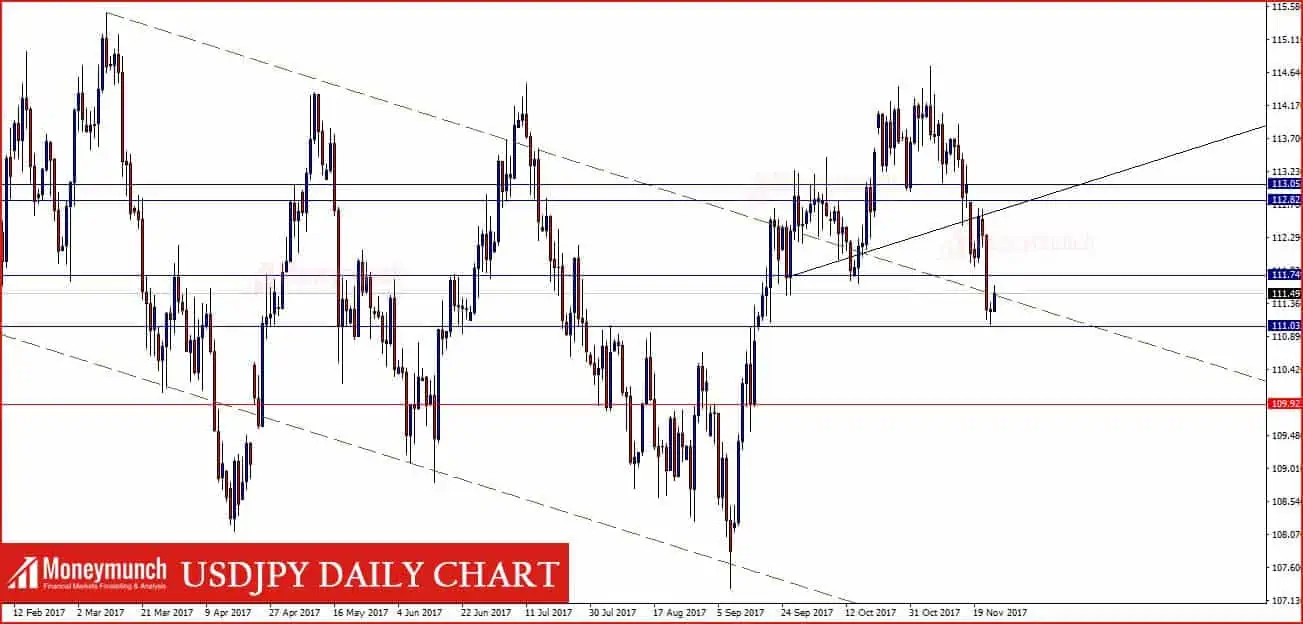
USDJPY index Technical Pattern Suggest bullish signals, you will see 111.749-112.302-112.823-113.052 levels soon.
If USDJPY close below 111.035 level then you can see 109.923 level.

[ultimate_heading main_heading=”BTC/USD HOT CALL : PREMIUM SUBSCRIBERS ONLY” main_heading_color=”#dd3333″ alignment=”left” margin_design_tab_text=”” main_heading_font_family=”font_family:Raleway|font_call:Raleway” main_heading_font_size=”desktop:32px;”][/ultimate_heading]
Continue reading

Forex Forecast : USDJPY,EURUSD,GBPUSD,USDCHF Indexs

usdjpy forecast signals

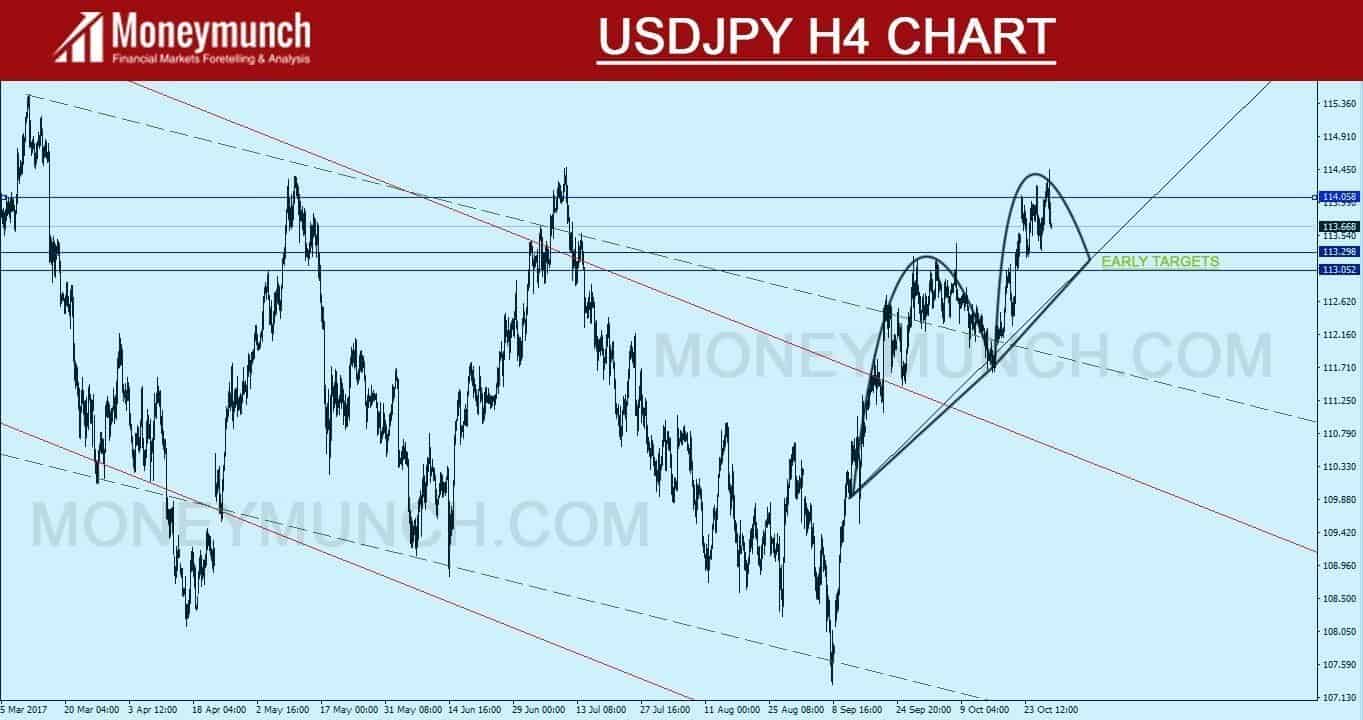
What had I said about USDJPY @ September 18, 2017, 1:26 am.
USDJPY technical pattern is indicating bullish sign.
We are recommending all of our subscribers to wait for time to crossover 111.432 level. After close above or crossover, you will see 114.075 level.
Keep in mind, USDJPY index STOCH(9,6) indicating bearish pattern 110.265-109.499-109.104 levels.

Clear Sell Signals for USDJPY Traders.
USDJPY waves targeting trading line, you can see 113.298-113.052 levels.

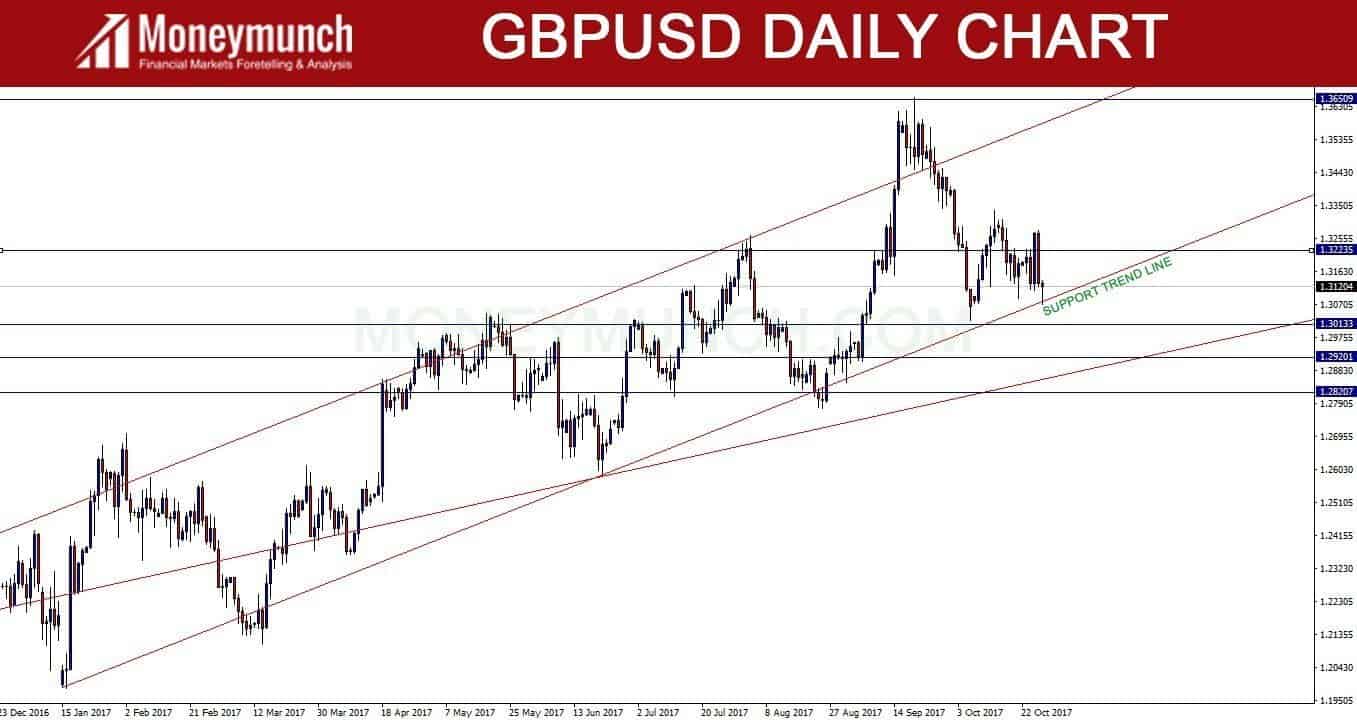
GBPUSD Signals

Follow our chart; you will expect 1.32235-1.36509 levels.
GBPUSD crossover or close below support trend line. Then you will definitely see 1.30133-1.29201-1.28207 levels.

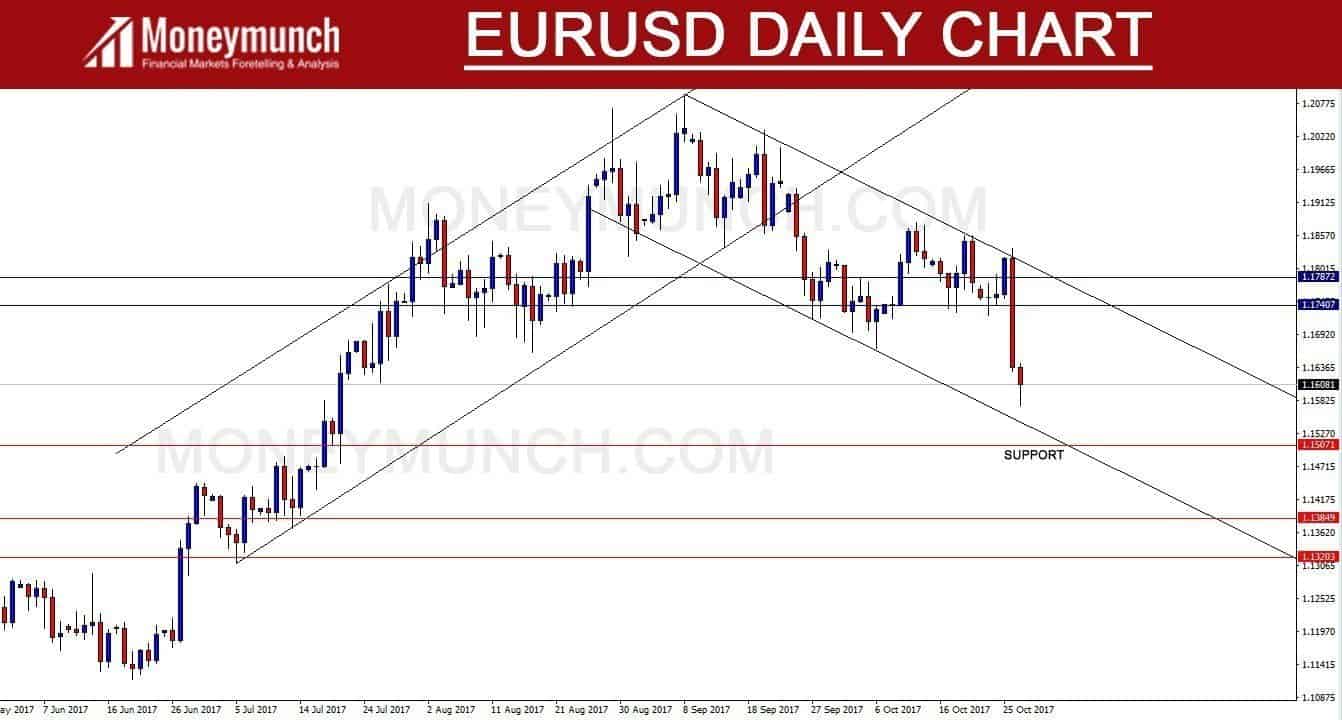
eurusd signals

EURUSD technical pattern suggest bearish trend.
Just Keep in Mind those levels: 1.15071-1.13849-1.13203.

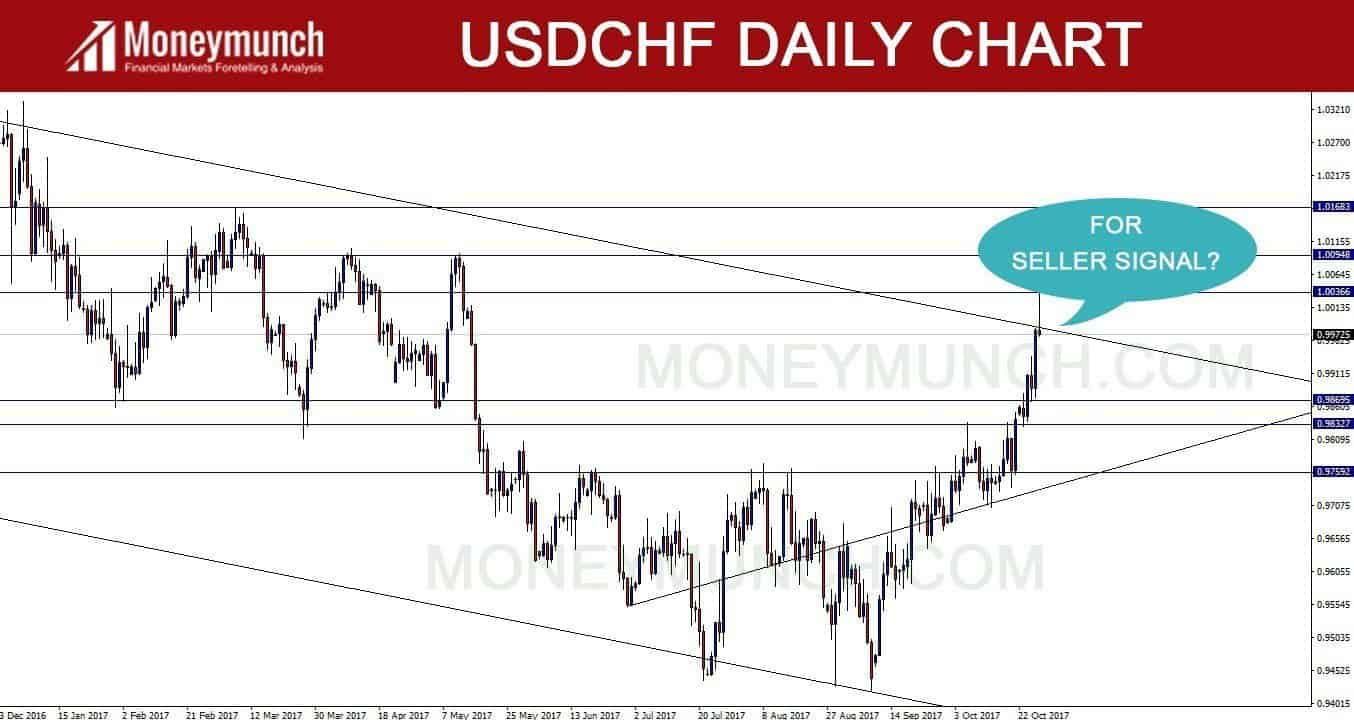
USDCHF forecast

For smart traders find your position in the chart.
Only for our premium subscribers.

For more Updates and Exact entry and exit, levels subscribe our Services.

Continue reading