This call was given to our subscribers
BUY NIFTY NOV FUT 12050
Stop-loss 12014, ONLY 36 point stop-loss
BOOKED PROFIT at 12550
500 POINTS PROFIT TAKEN, 500*75= 37,500 PROFIT

This defined the 12798 area as critical short-term resistance. It is important to note that the stock reversed after the AB=CD completion point will test. Although the BC projection was an important calculation within the PRZ of the pattern, the completion of the equivalent AB=CD structure was the defining limit. The chart of the price action in the PRZ shows the near-perfect reversal just the PRZ at 12798 nearby expecting…
I outlined that important level is at 12798 and Terminal Bar will decide for reversal confirmation.
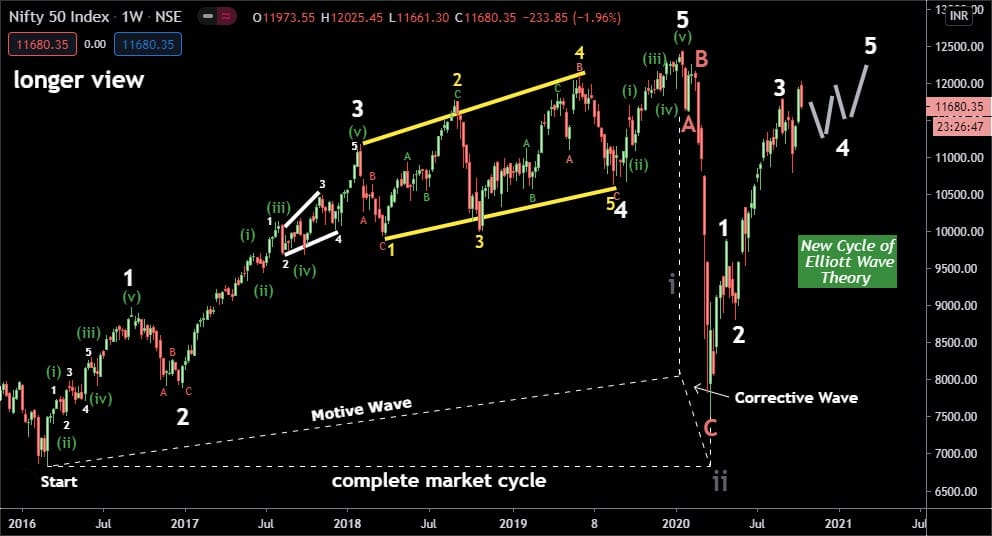
I have mixed use Breakdown + Elliott Basic Rules…
To become a subscriber, subscribe to our free newsletter services. Our service is free for all.


 Unlock This Article