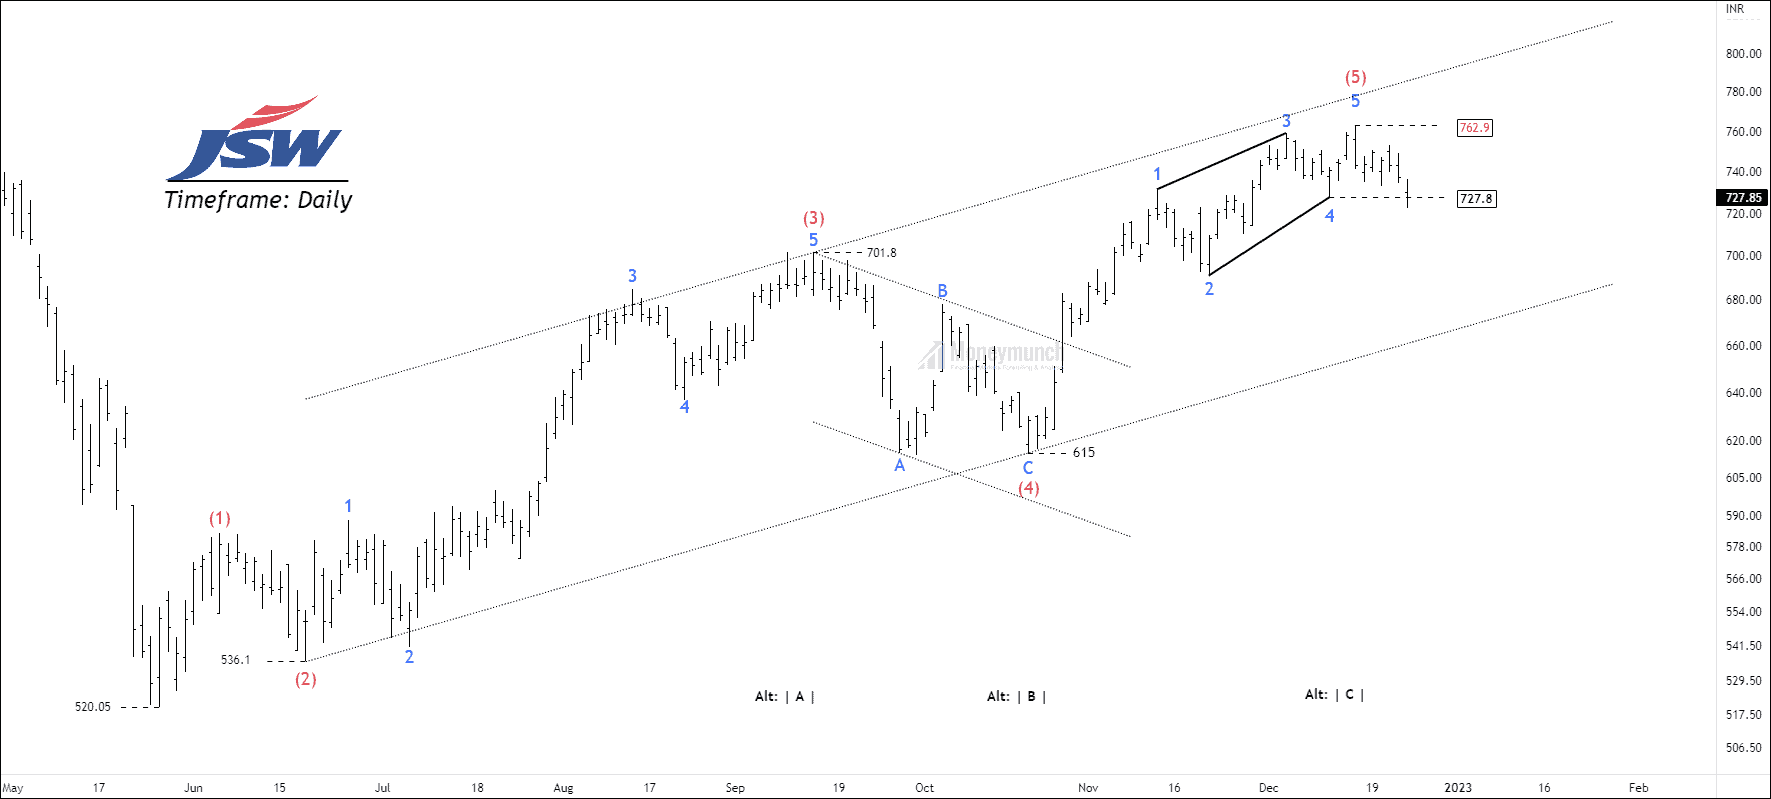
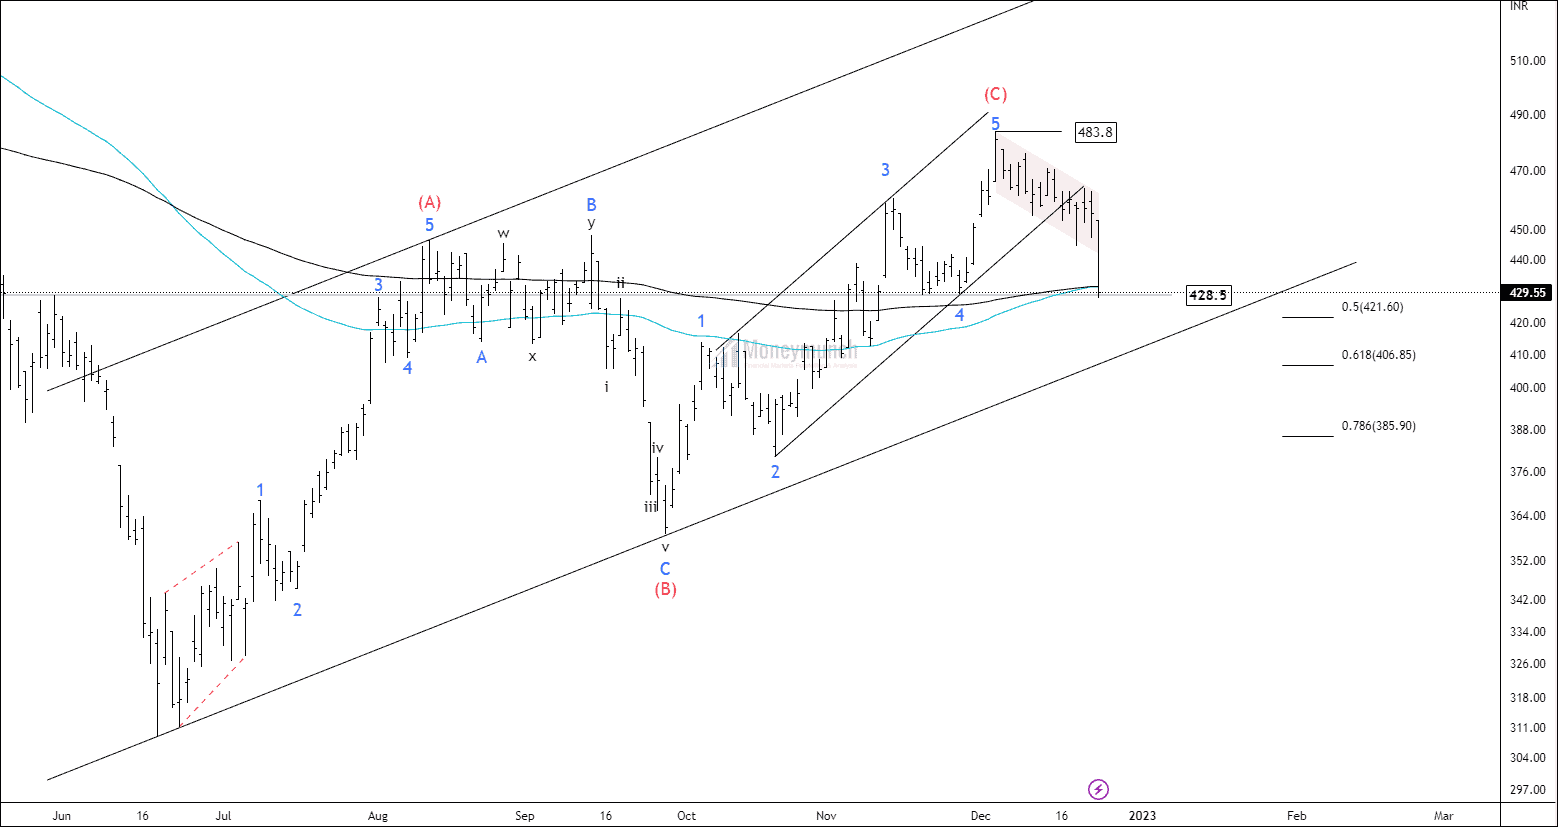
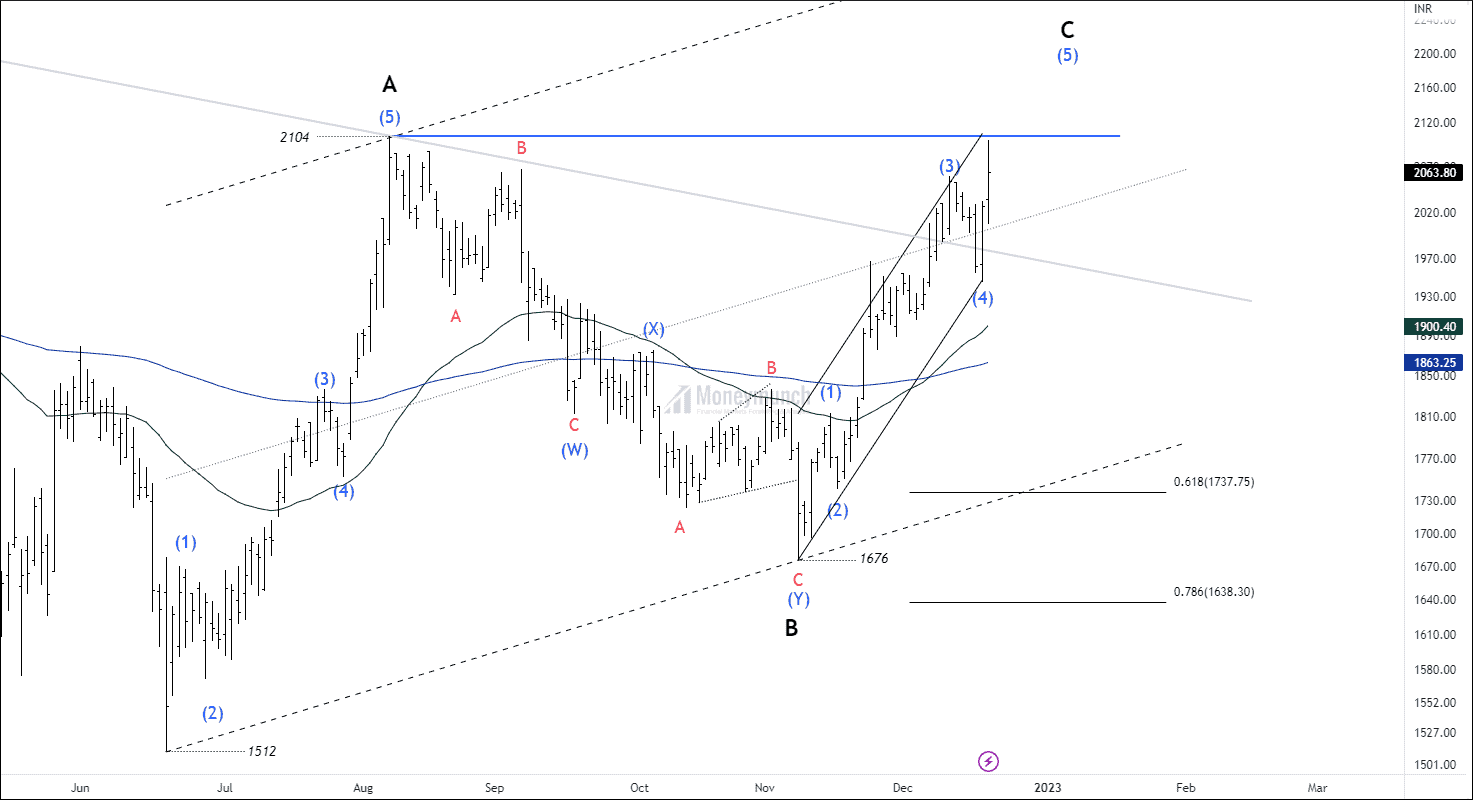
NSE HINDALCO – Elliott Wave Projection
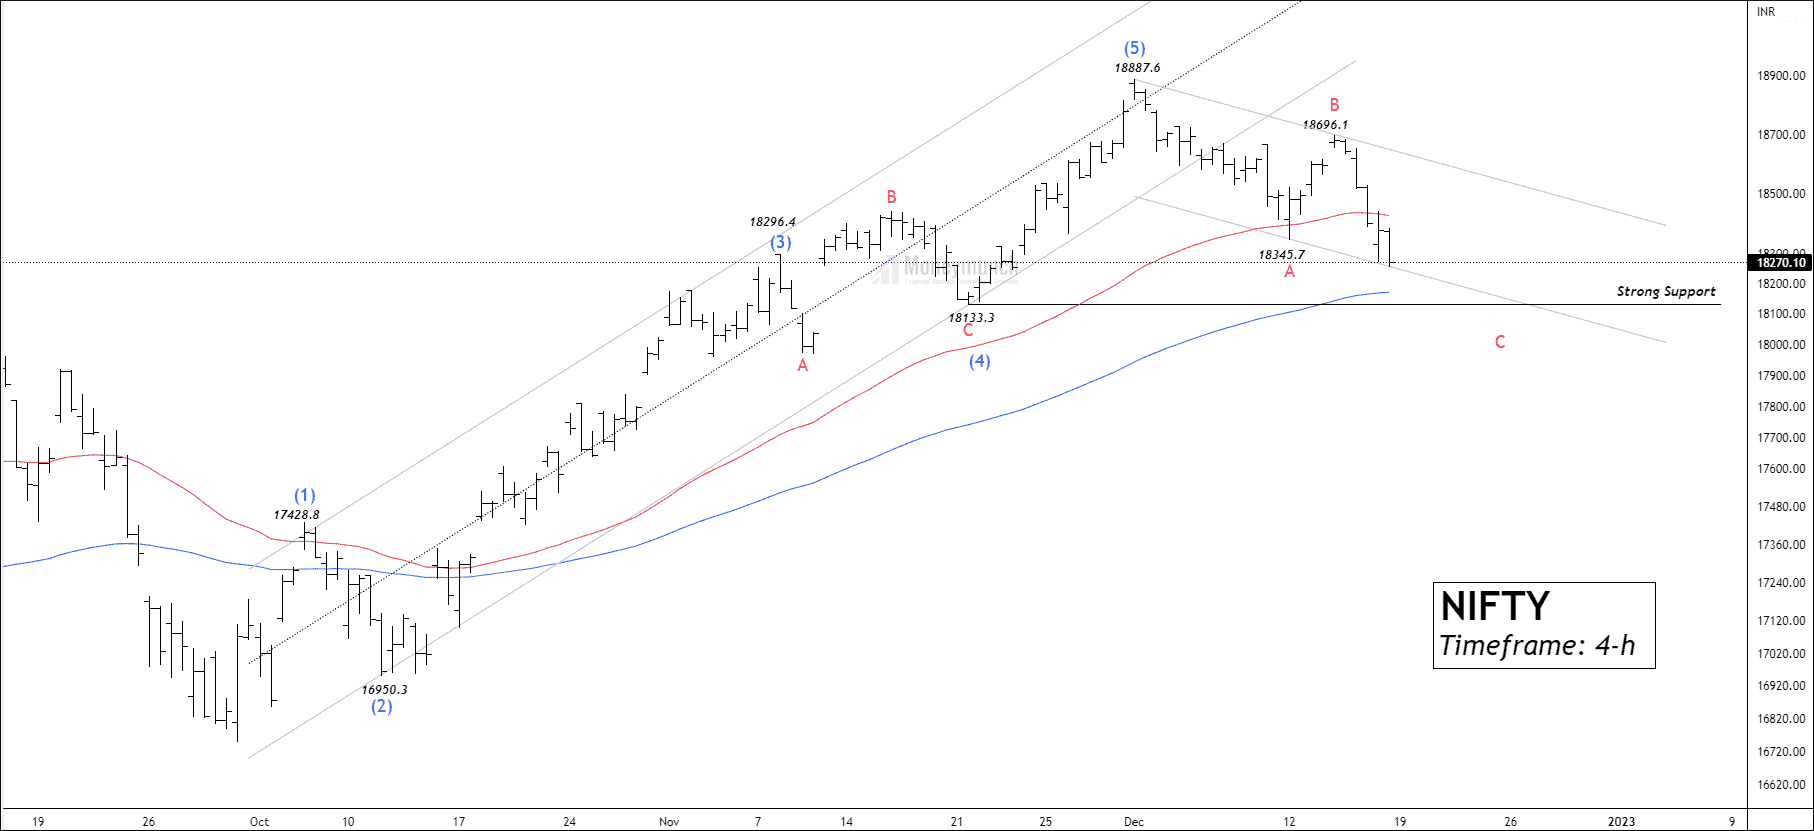
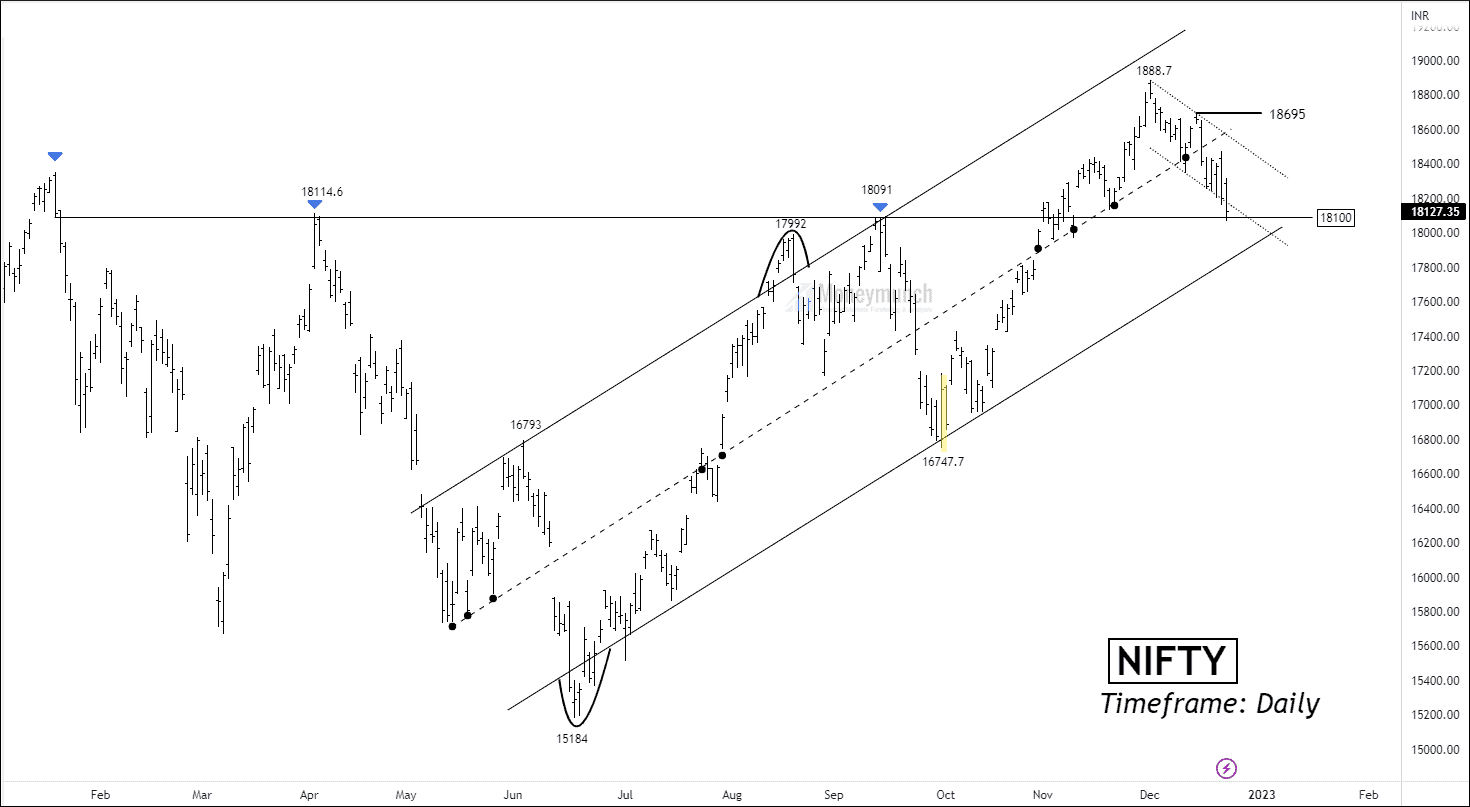
NIFTY: Does The Correction Go Far Enough?
Is NSE INDIGO Preparing For New High?
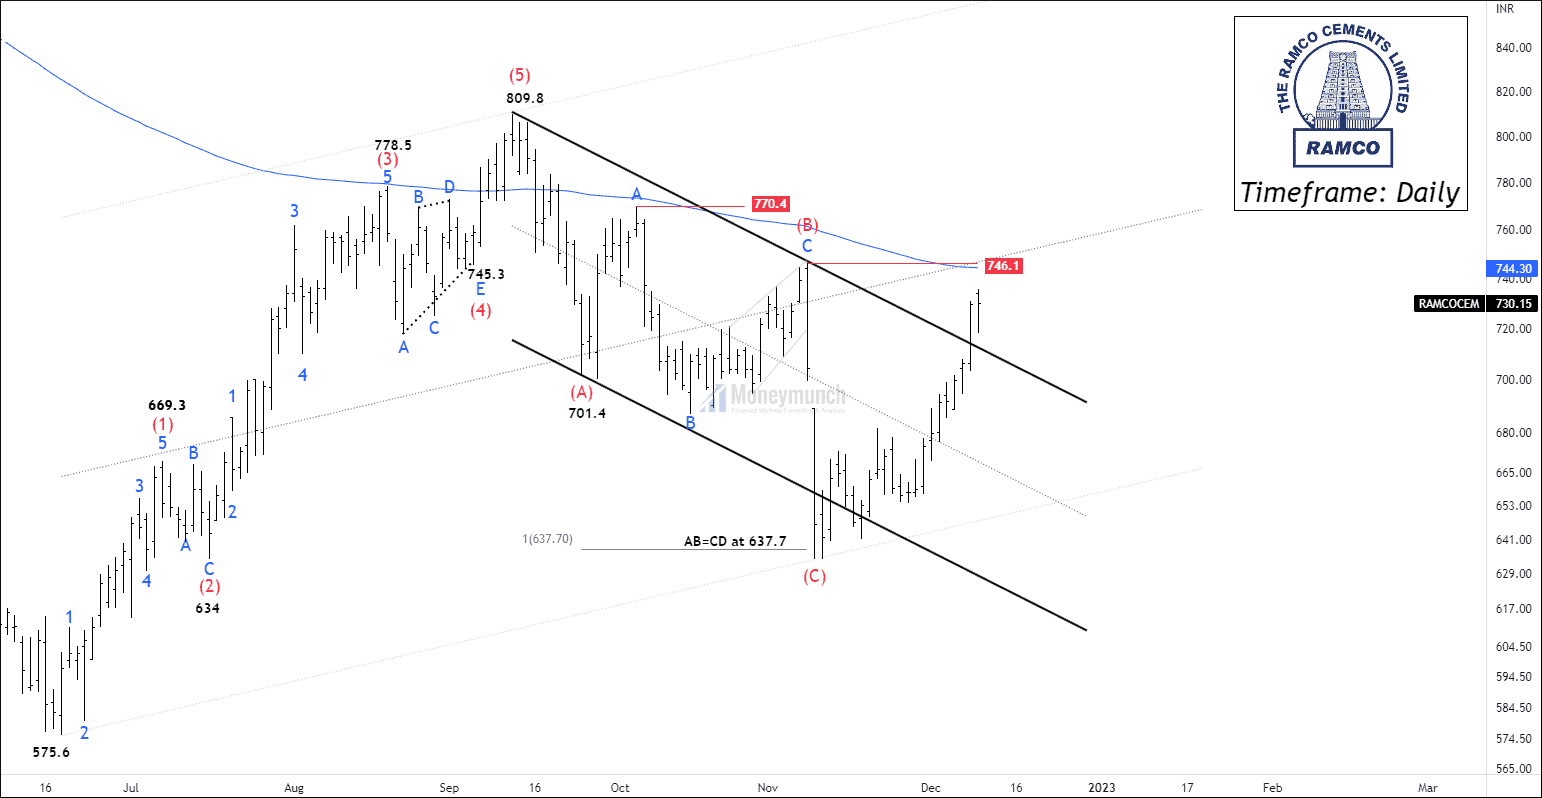
NSE RAMCOCEM: Tips & Updates
Today at 12:18 PM, we sent the following setup to our subscribers:
NIFTY FUT TRADE SETUP
R/R: 2.46
A LONG POSITION CAN BE AROUND 18260 – 18270 WITH A STRICT STOP LOSS OF 18228.
TARGETS: 18330 – 18350 – 18370.
(To become a subscriber, subscribe to our free newsletter services. Our service is free for all.)
Will NSE REMCOCEM Reach The Second Target?
Have you traded NSE RAMCOCEM?
Click here: NSE RAMCOCEM – Swing Setup
 Continue reading