
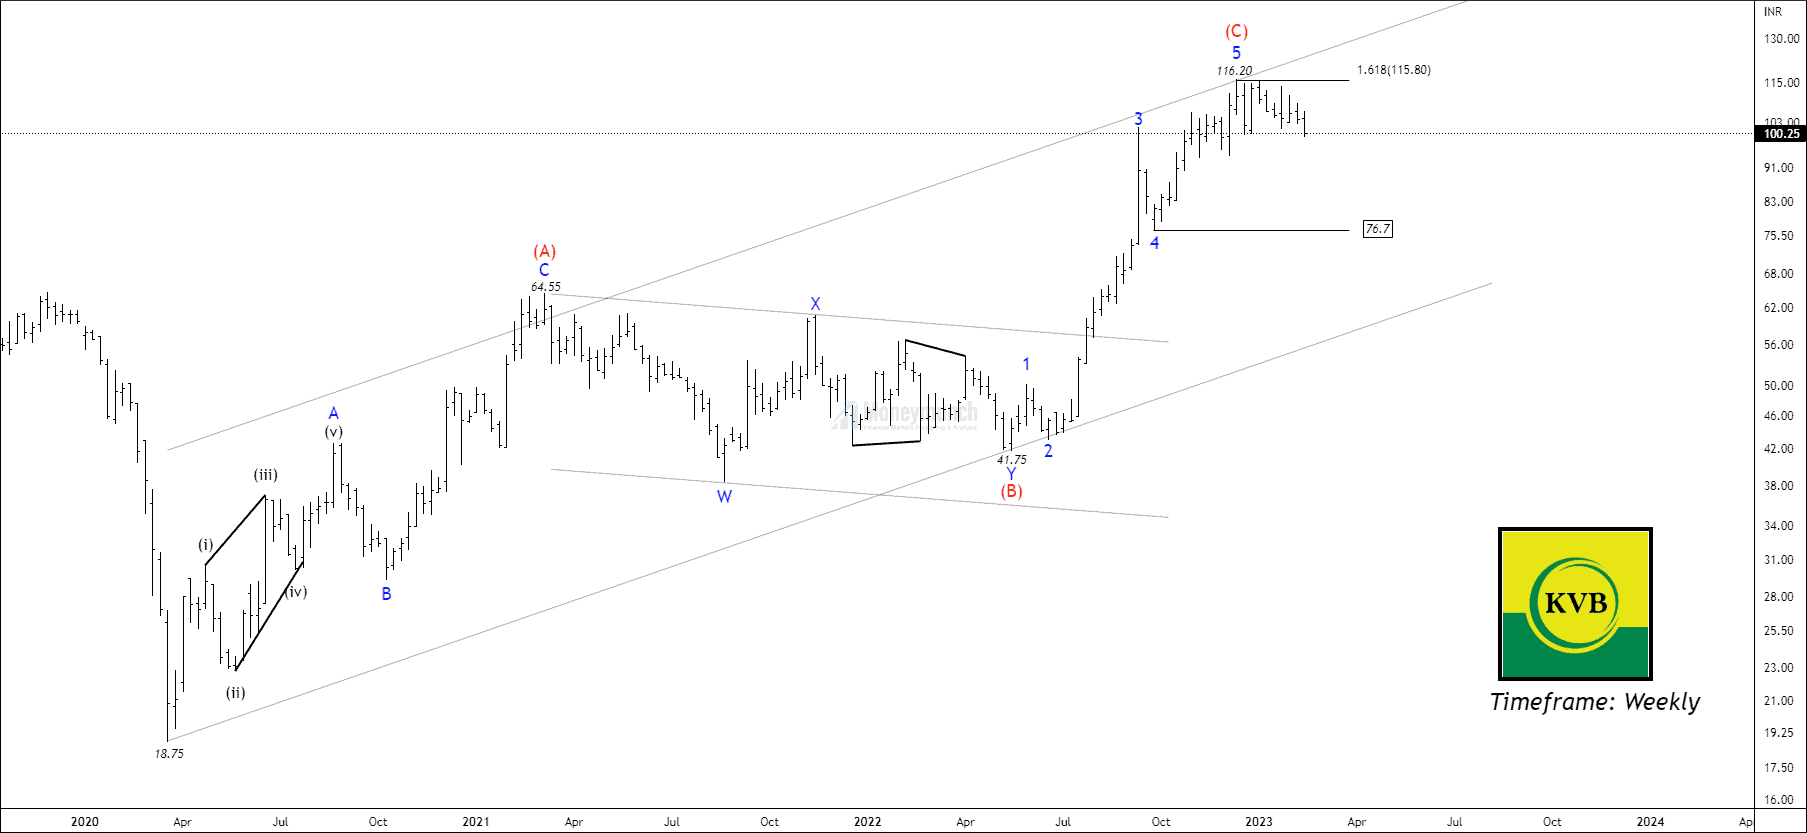
NSE KARURVYSYA – Elliott Wave Projection
NSE ABFRL – Motive Cycle Begins
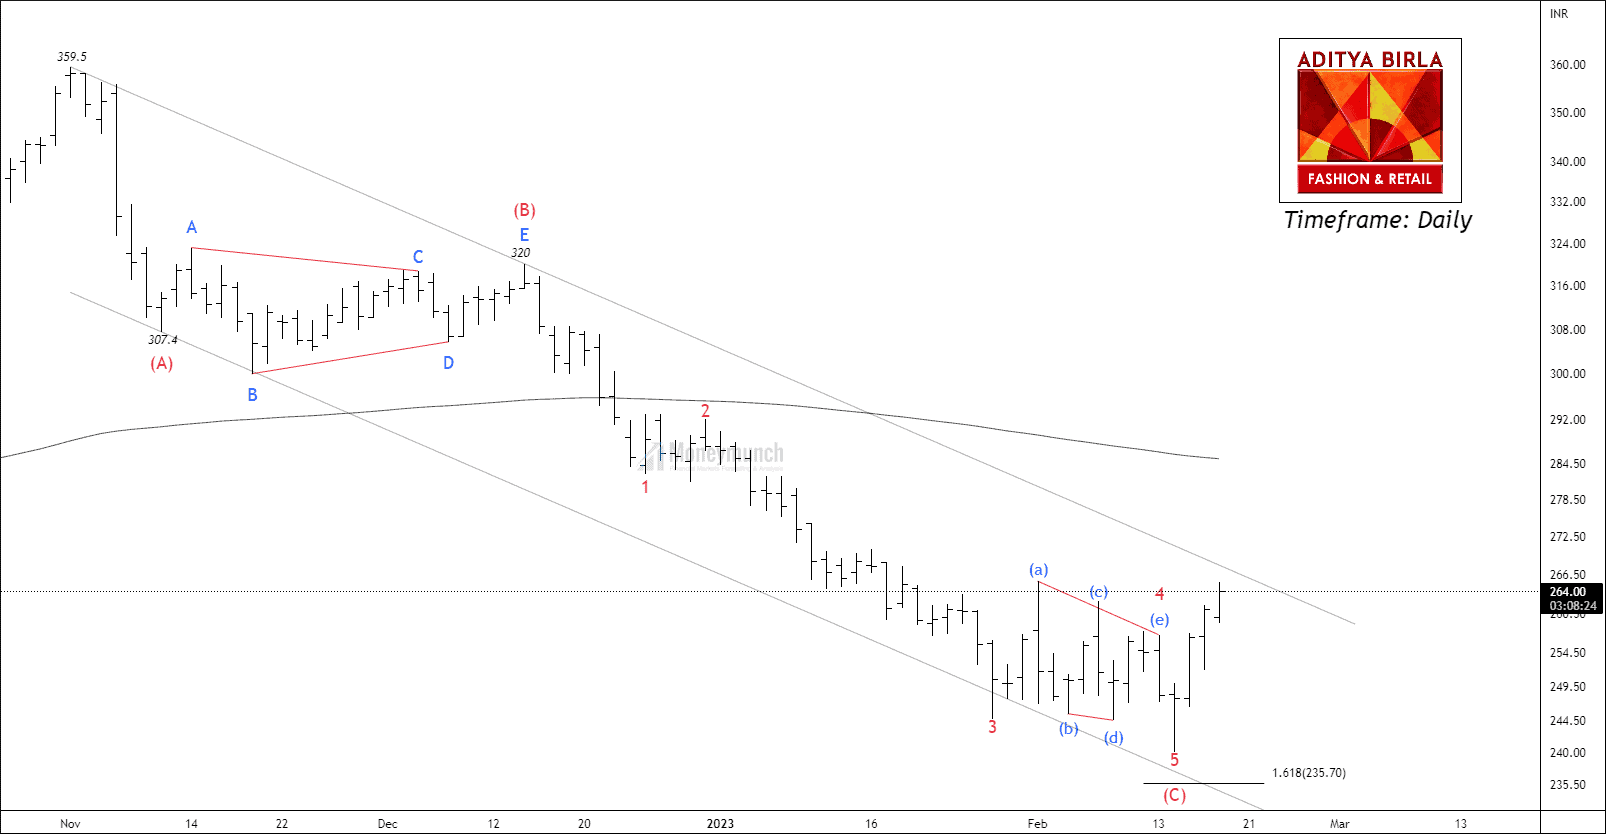
Timeframe: Daily
NSE ABFRL has been forming into the corrective formation for more than 15 weeks. This manner of the price is corrective because it is falling steeply into the channel.
As per the rule of the channel, the corrective wave respects the channel because they don’t have the power to break out from the parallel lines. The impulse breaks the channel, whereas the correction forms within it.
Currently, the price has accomplished wave 5 of wave (C) at 240, and the price started lifting near the upper band of the regression channel. This breakout can be a holy grail for bulls to reach near wave (B). Safe traders can wait for the retracement to ride the impulse.
 Unlock This Article
Only subscribers can read the full article. Please login to read the entire article.
Continue reading
EWT – NSE NIFTY Trade Setup For Subscribers
Only subscribers can read the full article. Please login to read the entire article.
ASTRAL FUT Trade Setup For Subscribers
Only subscribers can read the full article. Please login to read the entire article.
NSE HDFC Trade Setup For Subscribers
Only subscribers can read the full article. Please login to read the entire article.