FREE Stock, Commodity & Forex tips

Bharti Airtel (Stock Future) NSE CMP 333

Weekly-Chart-of-Bharti-Airtel-Stock

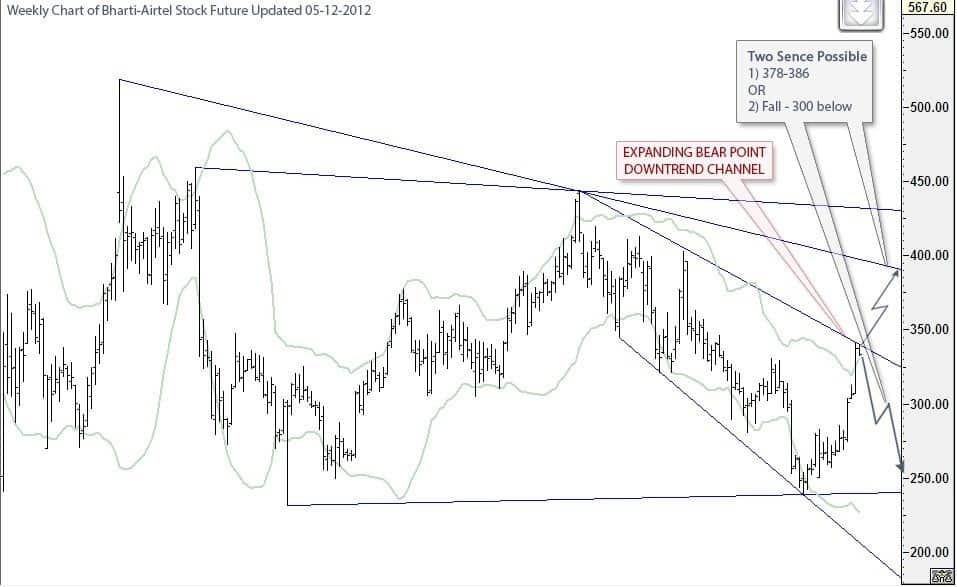
There are really times in the markets whenever things don’t appear to make good sense and is most of the time for some investors. Then there are times whenever every thing seems to line upwards and also things go based on an organize. Correct now, Bharti-Airtel Limited is trading 333 whereas you can grab great opportunity. Though, there are two option avaible in BHARTIARTL future stock as mentioned in chart of weekly. First option is go long and second to short selling.

Weekly-Chart-of-Bharti-Airtel-Stock

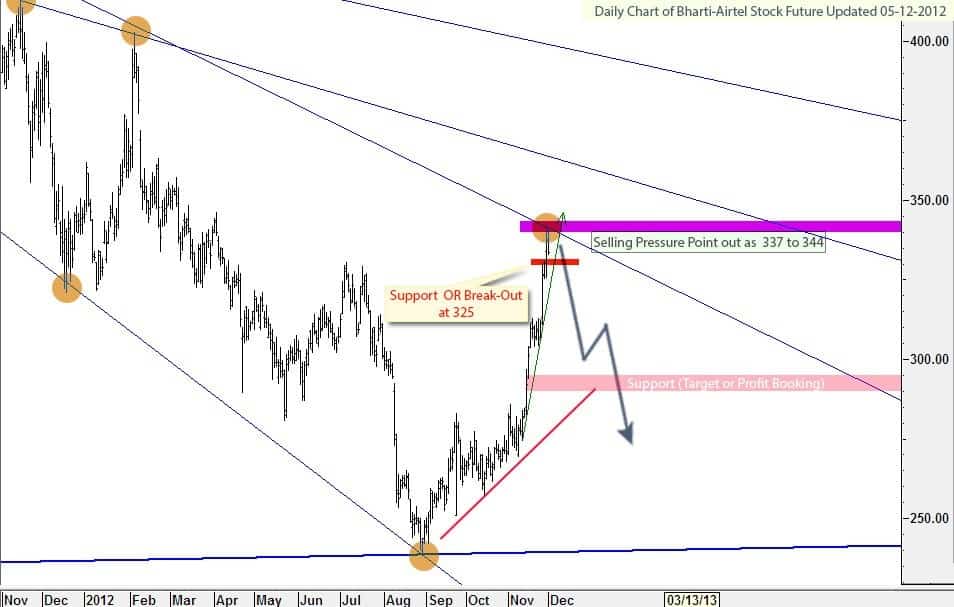
Let’s see how done comparing of short selling and long side. Look at chart with short selling point. Also, expected trend target 300 below. Suppose to trade below 325(Breakout down point/Support), then short selling single confirmed.

daily-chart-of-bharti-airtel

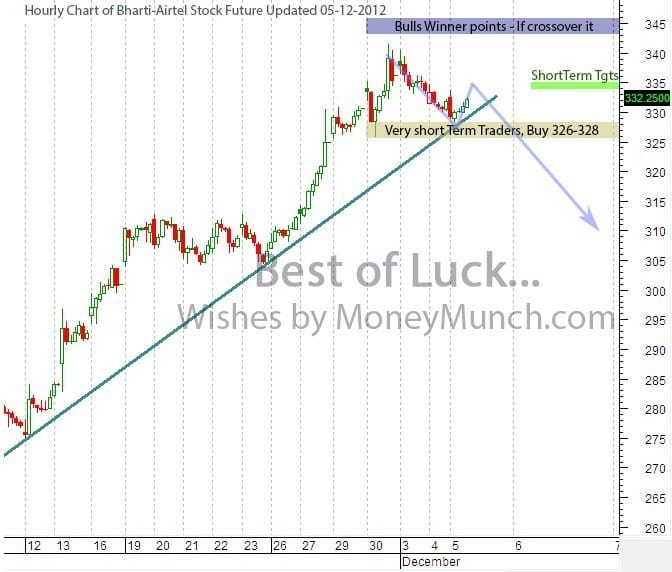
SUPPORT 324-328, Which is strong buyer points. If this support taking and crossover 345… then free of bulls rally to 367-377 easy.

trade-bharti-aritel

Just, follow only levels and Earn Trunk load money. I wish you happy earning on Bharti Airtel Stock Future. To become a subscriber, subscribe to our free newsletter services. Our service is free for all.

Get free important share market ideas on stocks & nifty tips chart setups, analysis for the upcoming session, and more by joining the below link: Stock Tips

Have you any questions/feedback about this article? Please leave your queries in the comment box for answers.
Disclaimer: The information provided on this website, including but not limited to stock, commodity, and forex trading tips, technical analysis, and research reports, is solely for educational and informational purposes. It should not be considered as financial advice or a recommendation to engage in any trading activity. Trading in stocks, commodities, and forex involves substantial risks, and you should carefully consider your financial situation and consult with a professional advisor before making any trading decisions. Moneymunch.com and its authors do not guarantee the accuracy, completeness, or reliability of the information provided, and shall not be held responsible for any losses or damages incurred as a result of using or relying on such information. Trading in the financial markets is subject to market risks, and past performance is not indicative of future results. By accessing and using this website, you acknowledge and agree to the terms of this disclaimer.

Previous ArticleNext Article
Mr.Guru(s) is a team of stock market certified technical and research analysts with over 20 years of experience. They are regular guests on popular online channels and contribute articles to several financial publications. Their insights and advice are respected by investors worldwide. With their collective knowledge and expertise, they have a proven track record of successfully predicting market movements and identifying profitable opportunities.

Join Today (Free): Stock & Nifty Tips

2 Comments

  1. yes , i understand the chart 50% by using MACD AND MOVING AVERAGES OF 20DAY,50DAY,100DAY AND 200DAY of course keeping in mind Candlestick stick
    most of my day trading i do by following above.
    But still I fail some time , and after reading chart of Bharti Airtel , i feel i need to learn trend line. Guru , can you help me to learn trend line which now i feel is a important Component to follow for making profit

  2. AWESOME AS USUAL I HAVE FULL CONFIDENCE IN YOU GURUJI THIS IS YET ANOTHER SIGN OF YOUR ACCURACY WITH SO LITTLE TO DO WITH HYPE WHETHER IT BE UPSIDE OR DOWNSIDE. HATS OFF

Write a Comment

Comment Policy: We love comments and appreciate the time that readers spend to share ideas and give feedback. However, all comments are manually moderated and those deemed to be spam or solely promotional will be deleted. Your email address will not be published. Required fields are marked *