Did you trade the NSE PNB Bearish setup?
Visit here: TRADE SETUP – NSE HAL, WIPRO, PNB & More
NSE PNB & AARTIDRUGS – Trading Insights & Updates
If the price continues to sustain below 121.25, it presents an opportunity for traders to initiate short positions with the following downside targets: 118.35 – 115.15 – 112.20+.
Timeline:
[13 February 2024]
- 09:20 AM – Price touched the first target of 118.35.
- 09:35 AM – NSE PNB made a new low of 115.70, which is close to our second target of 115.15.
If you have traded this setup, you could have made more than 4 points or 3.7% return in just a single trading session. Continue reading
NSE WIPRO – Tips & Updates
Did you trade the NSE WIPRO Breakout setup?
Visit here: TRADE SETUP – NSE HAL, WIPRO, PNB & More
We had written in clear words, “Should the price successfully breach and maintain levels above 501, traders may consider initiating positions with target prices set at 510 – 527 – 538+.”
Timeline:
[13 February 2024]
- 02:45 PM – NSE WIPRO hit the first target of 510, and made a high of 513.
If you have traded this setup, you could have made more than 2.47% or 12 points in just single trading session.Continue reading
TRADE SETUP – NSE HAL, WIPRO, PNB & More
NSE WIPRO – breakout setup
NSE Wipro has exhibited a cup and handle pattern on its daily timeframe chart, suggesting a potential breakout scenario. The stock is currently trading above its 10/35/50 Simple Moving Average band, indicating bullish momentum. Additionally, the Average Directional Index (ADX) reading is above 33, indicating significant strength in the prevailing trend.
Should the price successfully breach and maintain levels above 501, traders may consider initiating positions with target prices set at 510 – 527 – 538+. It is prudent for free traders to use the previous day’s low as a reference point for invalidation of the setup.
We will update further information for premium subscribers only.Continue reading
NSE ADANIENT – Elliott Wave Projection
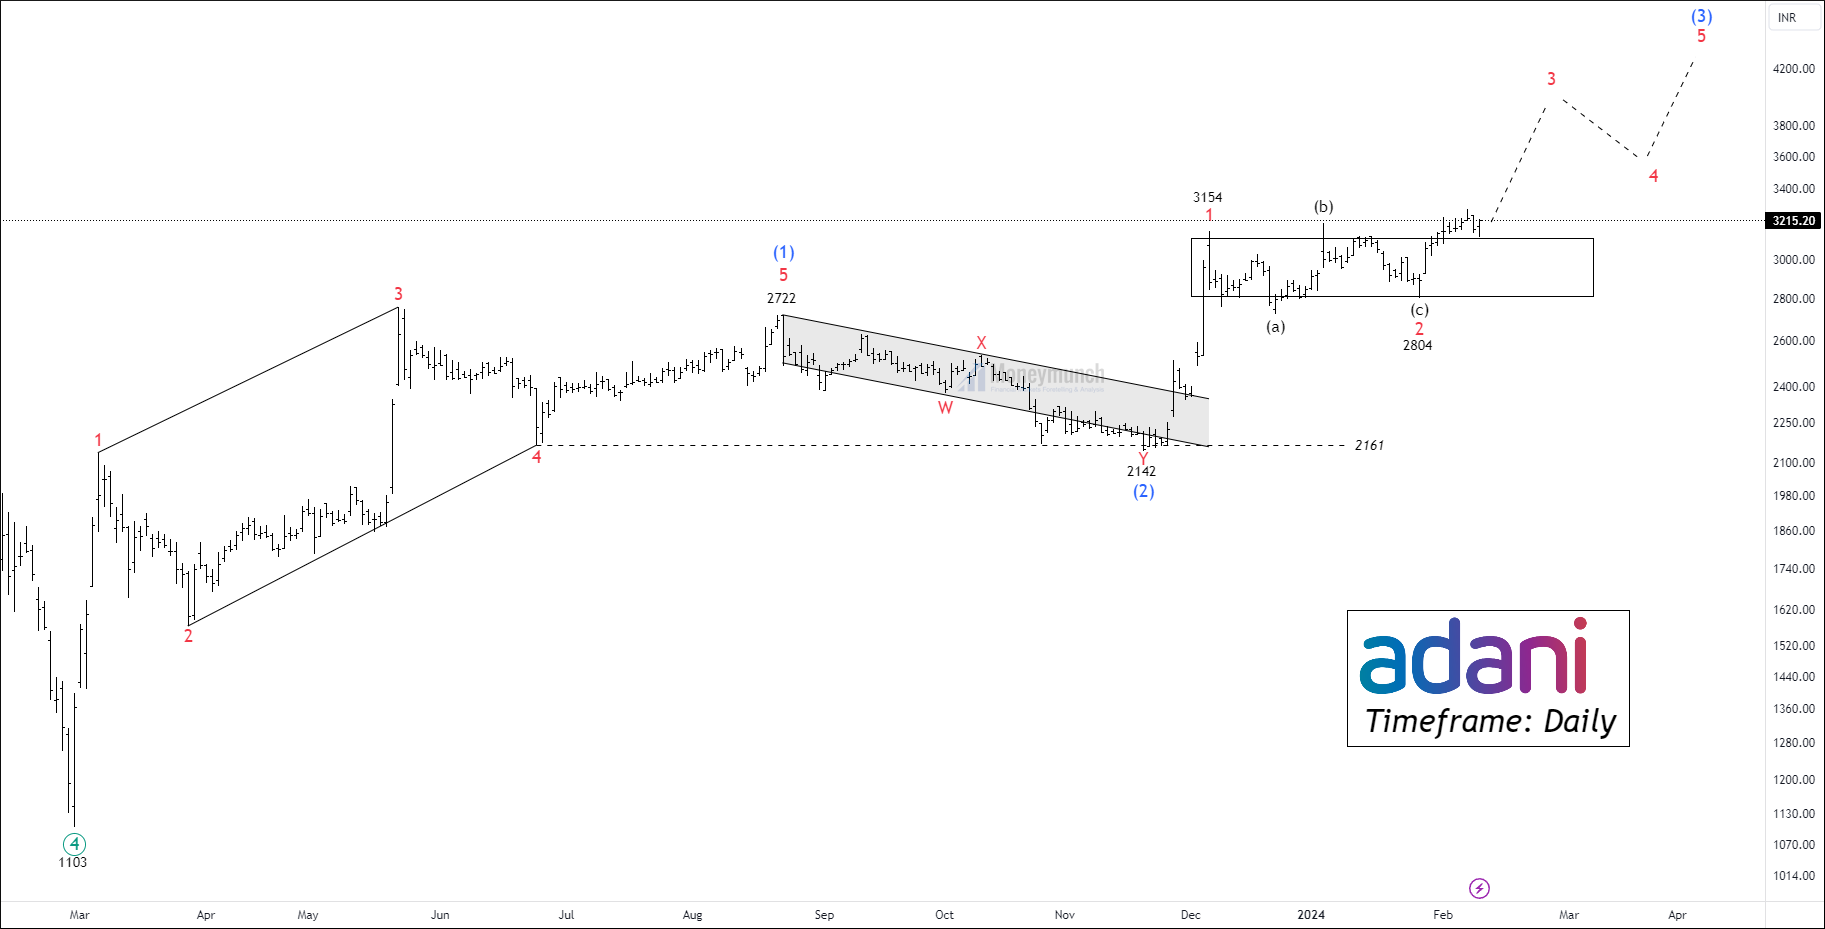
Timeframe: Daily
NSE ADANIENT had accomplished wave ((4)) at 1103 and started rising upward. The Average direction index is 34, which indicates the current trend is strong. Price has taken support from 50 SMA and trading above 200 EMA.
As per Elliott wave projection, The start of an impulse was a bit painful. Price constructed a leading diagonal on the wave (1). Wave (2) was a double zigzag because of the sharpness of the current trend. Price broke out wave (1) and established a building block of wave (3). Traders can count sub-waves 1 and 2 of wave (3). Wave (3) can occur at 4442 is 1.618% of wave (1). Possible targets of wave (3) are 3430 – 3816 – 4440+. Note that price may take time and form consolidation and break approach to reach the targets. Traders should wait for a pullback after every breakout.
We will update further information soon.
Get free important share market ideas on stocks & nifty tips chart setups, analysis for the upcoming session, and more by joining the below link: Stock Tips
Have you any questions/feedback about this article? Please leave your queries in the comment box for answers.
Disclaimer: The information provided on this website, including but not limited to stock, commodity, and forex trading tips, technical analysis, and research reports, is solely for educational and informational purposes. It should not be considered as financial advice or a recommendation to engage in any trading activity. Trading in stocks, commodities, and forex involves substantial risks, and you should carefully consider your financial situation and consult with a professional advisor before making any trading decisions. Moneymunch.com and its authors do not guarantee the accuracy, completeness, or reliability of the information provided, and shall not be held responsible for any losses or damages incurred as a result of using or relying on such information. Trading in the financial markets is subject to market risks, and past performance is not indicative of future results. By accessing and using this website, you acknowledge and agree to the terms of this disclaimer.