We can count waves using traditional patterns like Head and shoulders , Double Top and Bottom,
Triangle, cup & handle, etc. This article is about how you can count waves by identifying chart patterns.
I have covered Three chart patterns in this article,
1) Triangles
2) Head and shoulders
3) Double Top and Bottom
1) Head and shoulders :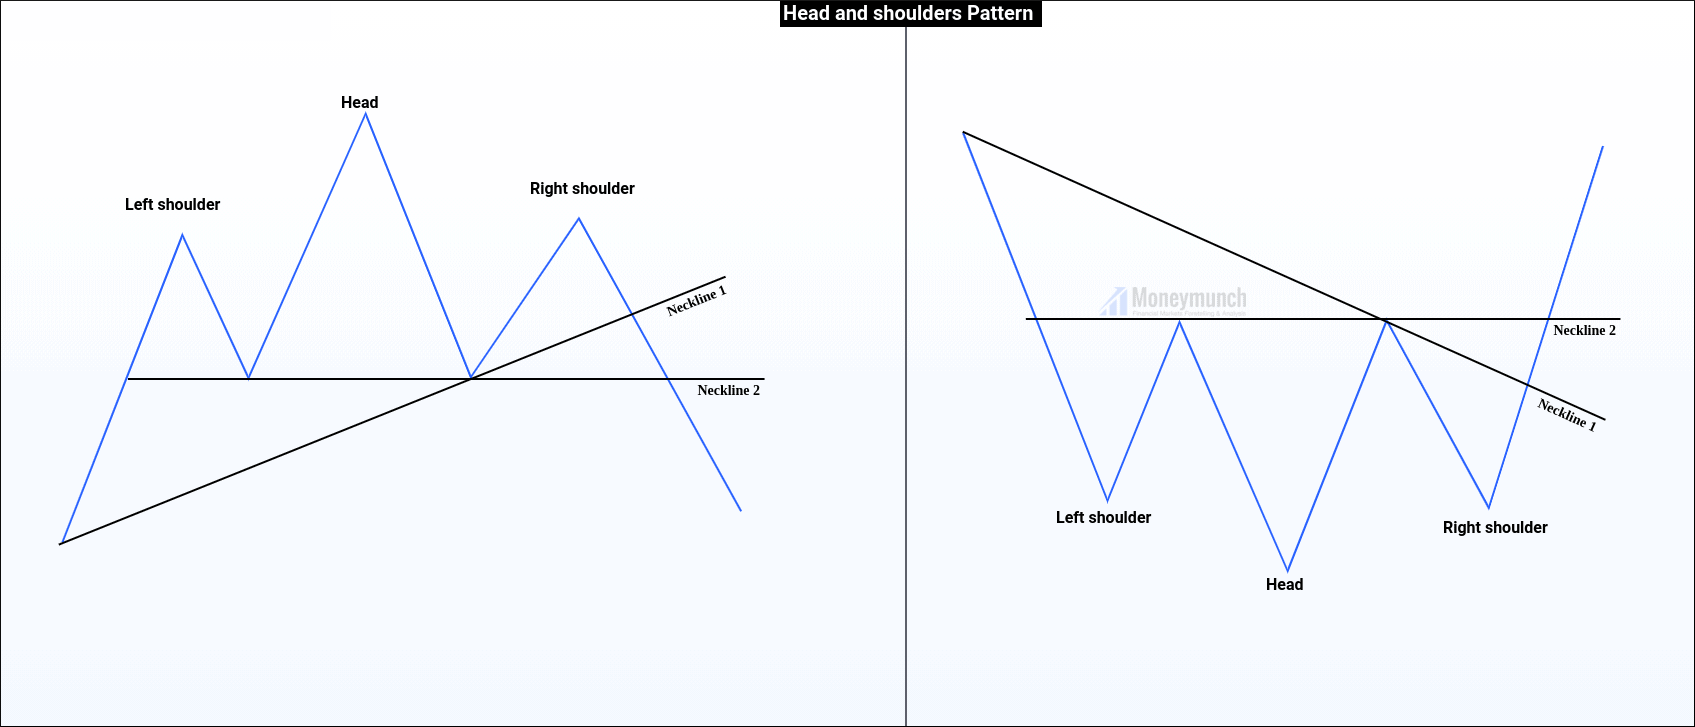
In addition, the two lows formed when the price failed to rise and fell back down were basically at the same level. The horizontal line is often referred to as the “neckline” When the price fails to fall back for the third time the neckline will break. So “head and shoulders” was officially established.
Changes in volume with head and shoulders:
During the formation of “head and shoulders”, the left shoulder has the largest volume , the Head has a slightly smaller volume , and the right shoulder has the smallest volume . The phenomenon of diminishing trading volume shows that when the stock price rises, the chasing force is getting weaker and weaker, and the price has the meaning of rising to the end.
Operation plan after the Head and shoulders appear:
When the head and shoulders formed, you can decisively follow up the short order. The formation of the head and shoulders indicates the beginning of a new round of decline in the market, and the minimum drop is the distance from the head to the neckline. The profit is very substantial. Therefore, studying the formation of the Head and Shoulders is also a necessary analysis process for band enthusiasts.
Wave Count:
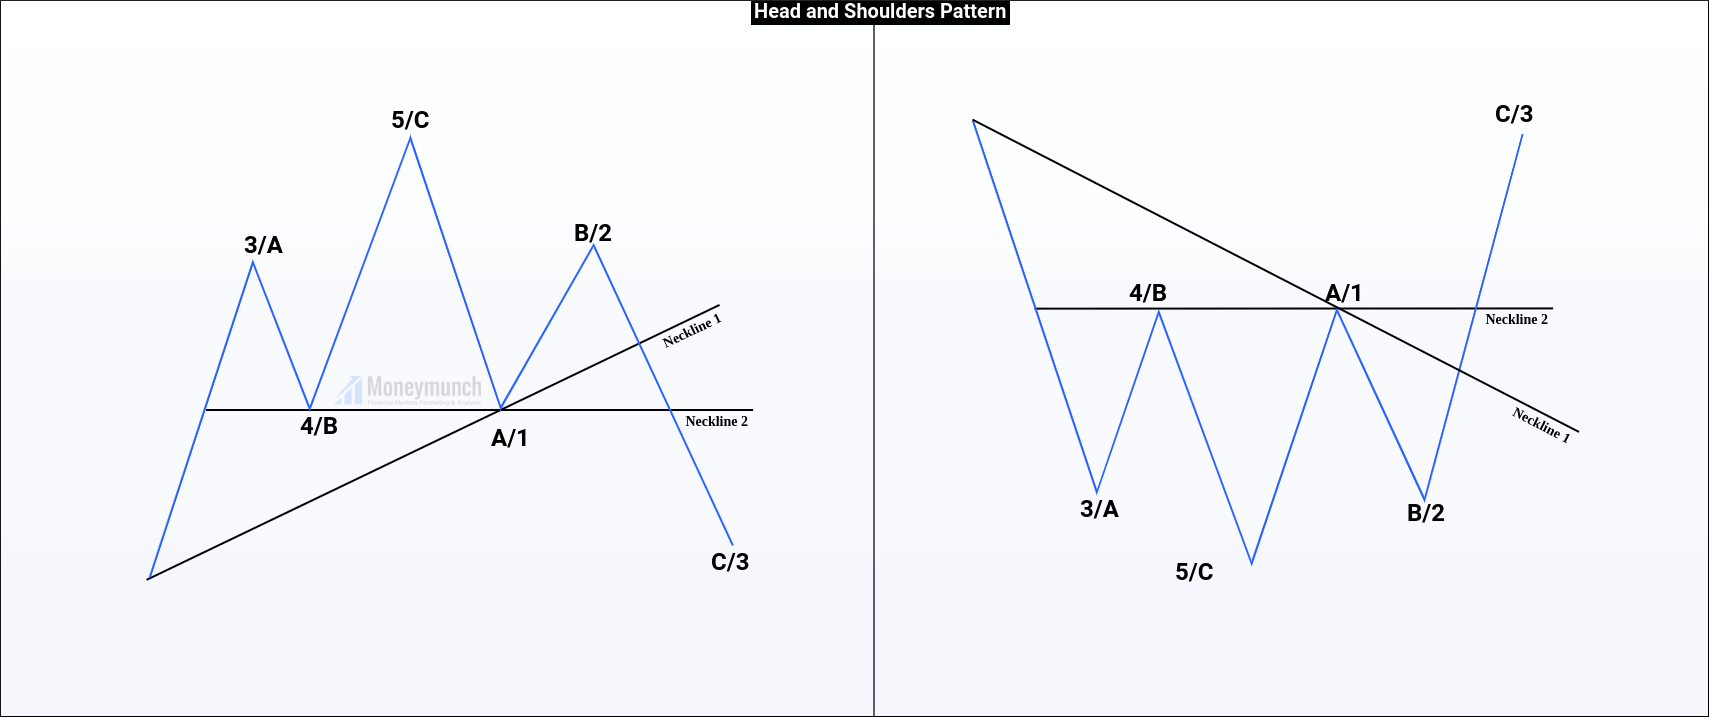
The left shoulder: wave 3/A.
The first touch on the neckline: wave 4/B
Head: wave 5/C
The second touch on the neckline: wave A/1
The right shoulder: wave B/2
The ending point of the right shoulder: wave C/3
2) Triangles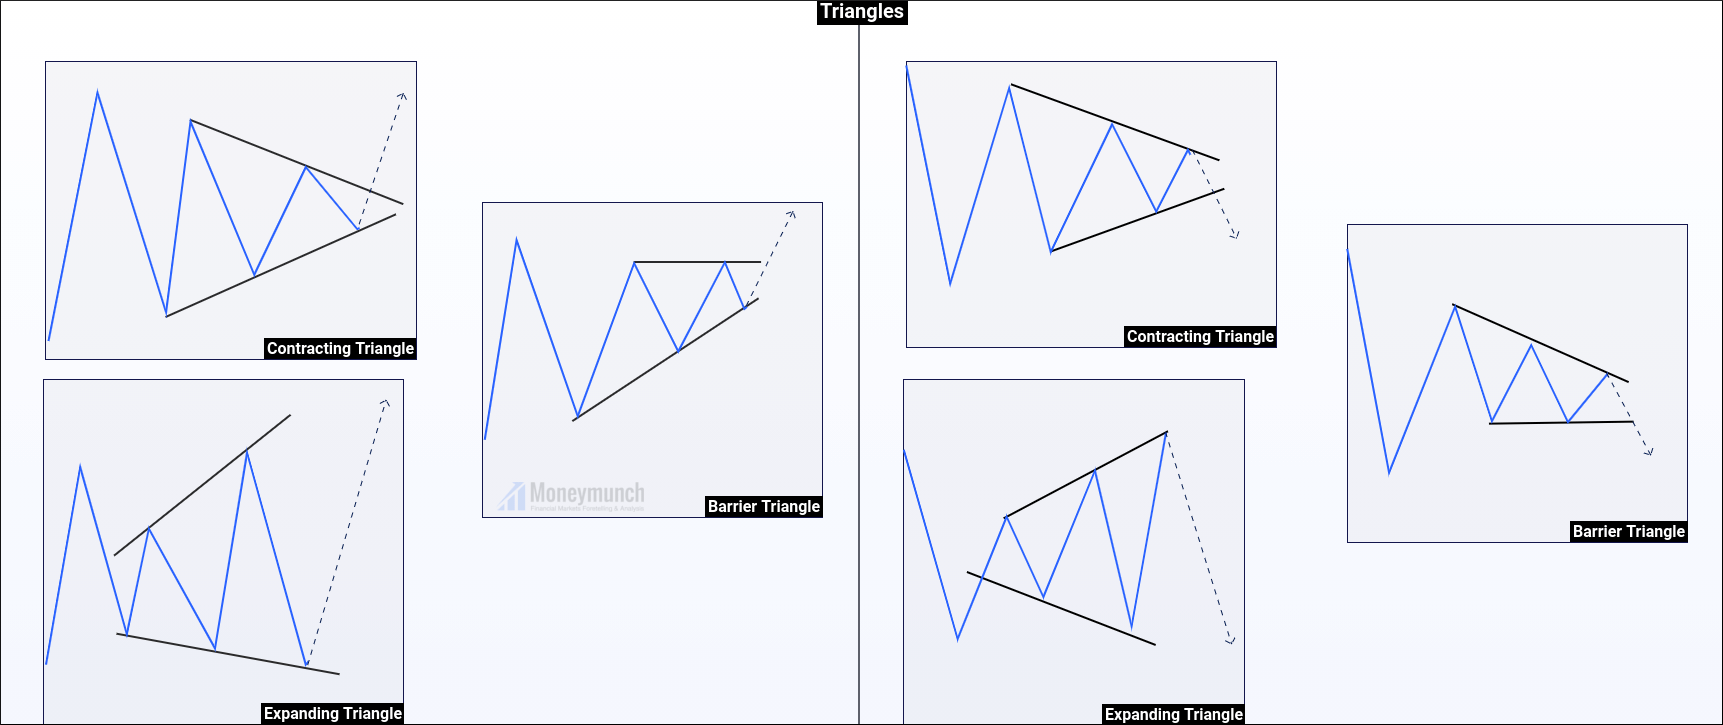
These are the most commonly used triangle patterns. In this motion, we are going to understand the triangle in terms of the Elliot wave. We’ll be talking about the classical triangle pattern in an upcoming educational series.
Wave Count: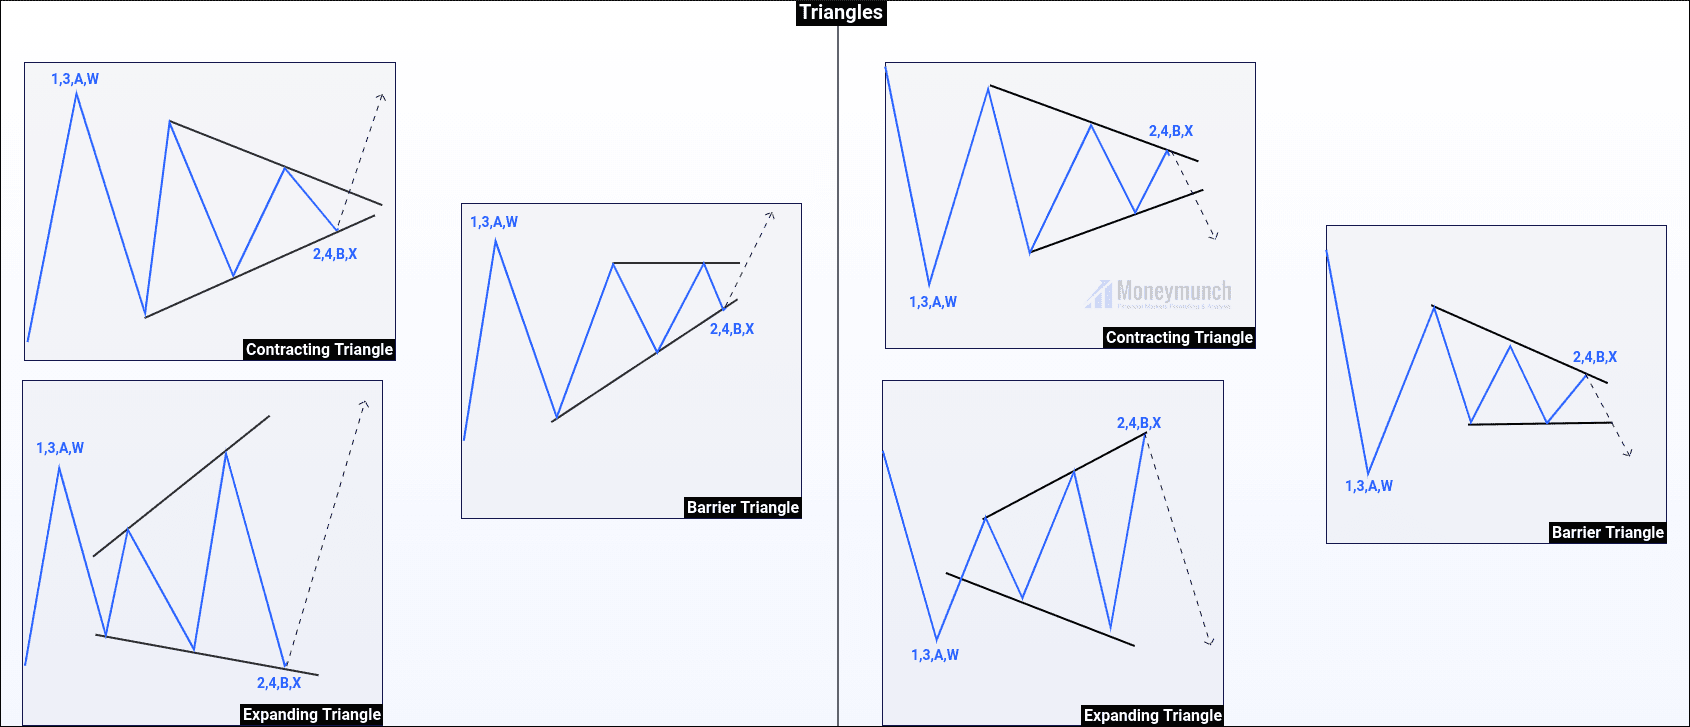
A triangle forms in corrective waves. There are Four corrective waves in Elliott wave theory. The corrective waves are 2,4, B, and X.
There are four waves in a triangle which are A, B, C, D, E.
The starting point of wave A of the triangle is the ending point of impulsive wave 1/3/A/W. After the completion of wave E of wave 1/3/A/W, the Impulsive wave will initiate.
3) Double Top/Bottom: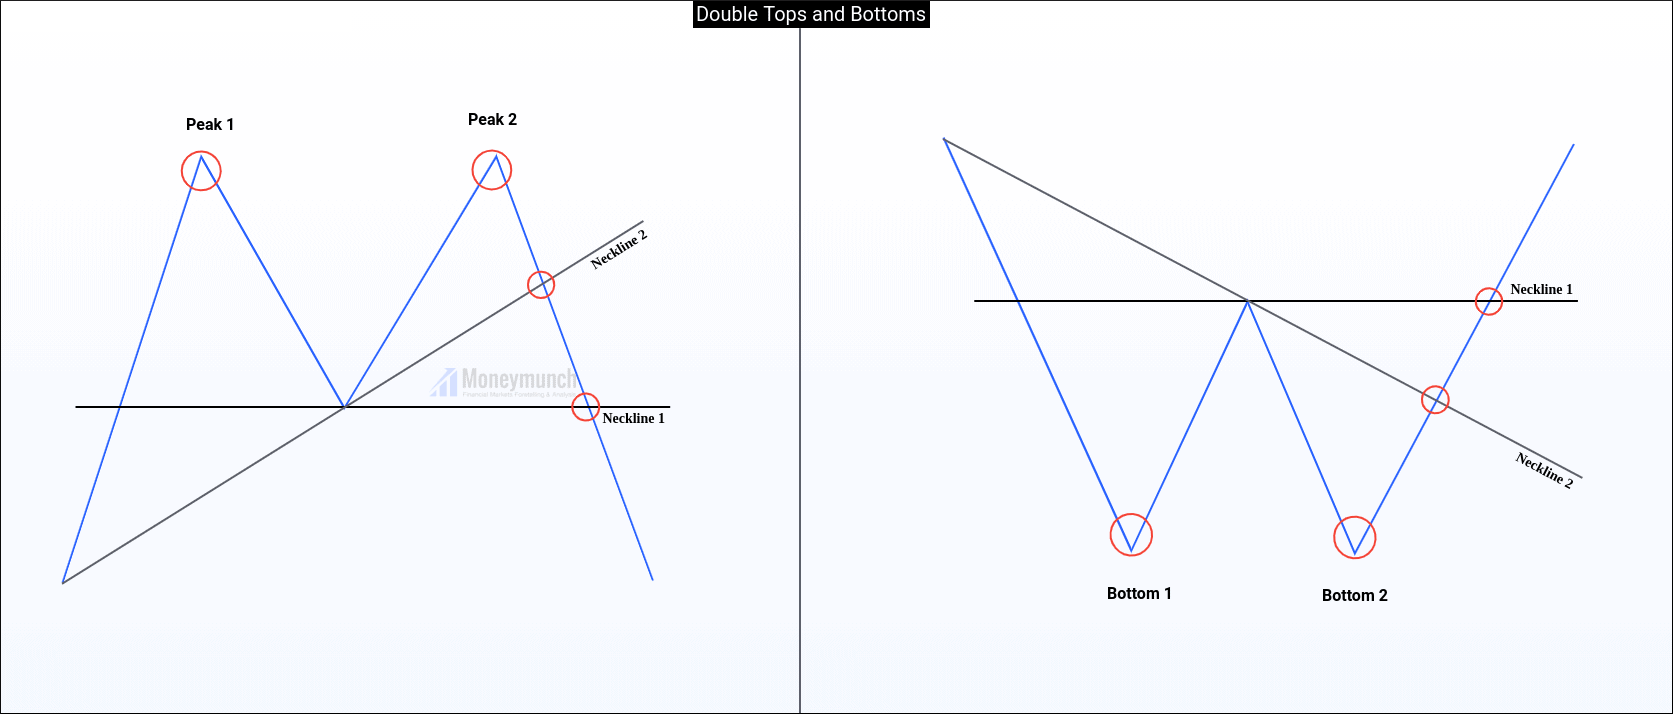
In the chart, you can sometimes see the stock price fluctuations. The stock price fell back after reaching the highest price. After some sorting, it rose again to near the previous stock price level and then fell back. Two “normally highs” The high point is formed on the circuit diagram and will not be seen again in the short term.
Wave Count: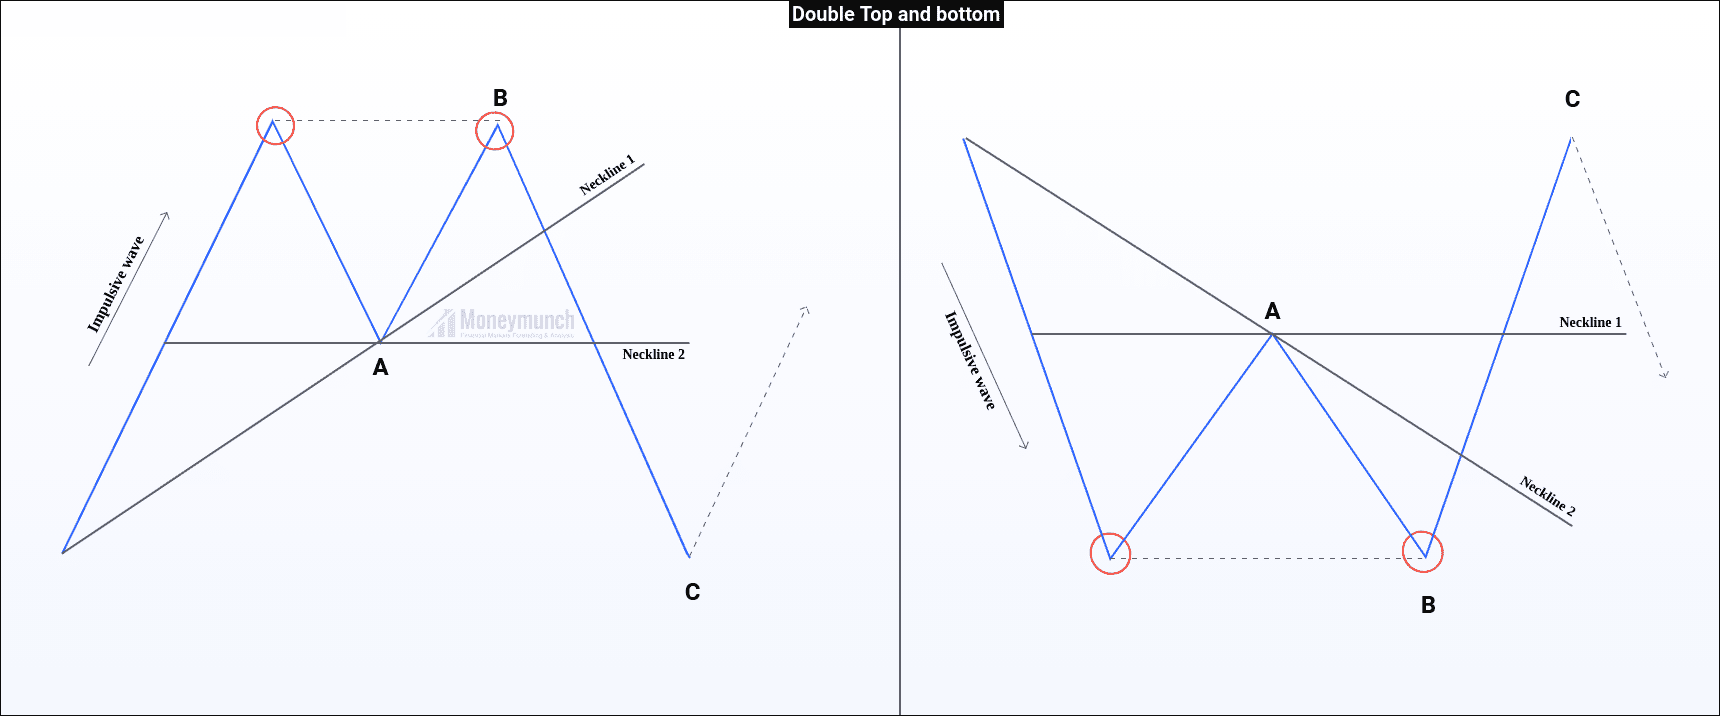
In a Bull market, The first Top of the pattern represents the completion of the impulsive wave. The ending point of the Impulsive wave is the starting point of the corrective wave.
I started the wave count from the first top and labeled it as A, B, and C waves.
In a Bear Market, The first bottom of the pattern represents the completion of the impulsive wave. The ending point of the Impulsive wave is the starting point of the corrective wave.
I started the wave count from the first bottom and labeled it as A, B, and C waves.
After wave C is complete, we can ride the impulsive waves.


 People don’t believe how simple it is to accumulate a significant amount of wealth, but it really is quite easy. All you need is a bit of discipline and to know the three steps necessary anyone can take to grow a significant net worth. The steps are: