Thought of Day for Tuesday 2013
Thoughts of the day on Monday, may 2013
Wyckoff Chart Reading
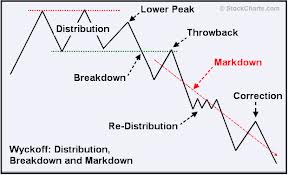
The Wyckoff Method is one of the four timeless approaches to market analysis (the other three being Dow Theory, Shabacker’s chart patterns, Elliott Wave Theory and Gann’s swing trading approach). It was developed in the early part of the 20th Century and has been continuously refined through the present day. The Wyckoff Method is a vital, classic approach to trading which reads the market through price bars and volume. Although technical indicators may be used, they are unnecessary under the Wyckoff Method.
Richard D. Wyckoff was a Wall Street broker and trader in the early part of the 20th Century. Wyckoff was a broker and witnessed the operations of the largest traders of his day first hand as an ‘insider’ and learned to translate their activities in the ticker tape and bar charts. As he watched traders and investors make poor trading decisions based on rumor, opinion and guesswork, he wrote a newsletter that quickly became so widely read on Wall Street that it would often affect stock prices. He later wrote courses for traders and books on tape reading (including the first day trader’s manual) and his experiences on the Street.
The Wyckoff Method has been used by astute traders for nearly 80 years. It is a complete method for understanding and trading the markets. It is used effectively by day traders, swing traders and investors in all markets including equities, commodities, index futures and FX with equal success. Many of today’s top market technicians acknowledge Wyckoff as the basis for their understanding of the markets, and the Method has spawned spin-offs such as VSA.
Dr. Gary Dayton is an expert in the Wyckoff Method. He has studied and applied Wyckoff for the past decade and has been mentored by an acknowledged Wyckoff master. Dr. Gary is also an outstanding educator of the Method who conveys the Wyckoff Method and principles in a simple and concise manner easily understood by his students.
TABLE OF CONTENTS
Candlestick and Chart Patterns (15 Days)
7 Most Important Candlestick Chart Patterns
- Gap Down Chart Pattern
- Gap Up Chart Pattern
- Gravestone Short-term Chart Pattern
- Hammer Candle Stick Chart Pattern
- Hanging Man Short-term Stock Chart Pattern
- Inverted Hammer Stock Chart Pattern
- Shooting Star Candle Stick Pattern
Top 2 Bearish Chart Patterns
Top 6 Bullish Chart Patterns
- Engulfing Line (Bullish) Chart Pattern
- Exhaustion Bar Chart Pattern (Bullish)
- Inside Bar Chart Pattern
- Island Bottom Chart Pattern
- Key Reversal Bar (Bullish) Chart Pattern
- Two Bar Reversal (Bullish) Chart Pattern
Indicators & Oscillators (12 Days)
Bullish or Bearish Indicators
Bullish or Bearish Oscillators
- Bollinger Bands Oscillator
- Commodity Channel Index (CCI)
- Fast Stochastic Oscillator
- Know Sure Thing (KST) Oscillator
- Momentum Oscillator
- Moving Average Convergence/Divergence (MACD) Oscillator
- Relative Strength Index (RSI)
- Slow Stochastic Oscillator
- Williams %R Oscillator
Classic Chart Patterns (29 Days)
Bearish Classic Chart Patterns
- Continuation Diamond (Bearish) Chart Pattern
- Continuation Wedge (Bearish)
- Descending Continuation Triangle Chart Pattern
- Diamond Top Chart Pattern
- Double Top Chart Pattern
- Downside Break Chart Pattern – Rectangle
- Flag Bearish Chart Pattern
- Head and Shoulders Top Chart Pattern
- Megaphone Top Chart Pattern
- Pennant Bearish Chart Pattern
- Rounded Top Chart Pattern
- Symmetrical Continuation Triangle (Bearish)
- Top Triangle/Wedge Chart Pattern
- Triple Top Chart Pattern
Bullish Classic Chart Patterns
- Ascending Continuation Triangle Chart Pattern
- Bottom Triangle Or Wedge Chart Pattern
- Continuation Diamond (Bullish) Chart Pattern
- Continuation Wedge Chart Pattern (Bullish)
- Cup with Handle Bullish Chart Pattern
- Diamond Bottom Chart Pattern
- Double Bottom Chart Pattern
- Flag Bullish Chart Pattern
- Head and Shoulders Bottom Chart Pattern
- Megaphone Bottom Chart Pattern
- Pennant Bullish Chart Pattern
- Round Bottom Chart Pattern
- Symmetrical Continuation Triangle Bullish
- Triple Bottom Chart Pattern
- Upside Breakout Chart Pattern – Rectangle
Best Trading Theories (4 Days)
- Basics of Dow theory trading strategy forecasts
- Motive (Impulse) Waves
- Corrective Waves
- Wyckoff Chart Reading
Kind attention: this course is helpful for beginner and intermediate traders. It’s free for everyone. Advanced modules, trading strategies, and data (in-depth) are available for Moneymunch’s premium subscribers.
Get free important share market ideas on stocks & nifty tips chart setups, analysis for the upcoming session, and more by joining the below link: Stock Tips
Have you any questions/feedback about this article? Please leave your queries in the comment box for answers.
Disclaimer: The information provided on this website, including but not limited to stock, commodity, and forex trading tips, technical analysis, and research reports, is solely for educational and informational purposes. It should not be considered as financial advice or a recommendation to engage in any trading activity. Trading in stocks, commodities, and forex involves substantial risks, and you should carefully consider your financial situation and consult with a professional advisor before making any trading decisions. Moneymunch.com and its authors do not guarantee the accuracy, completeness, or reliability of the information provided, and shall not be held responsible for any losses or damages incurred as a result of using or relying on such information. Trading in the financial markets is subject to market risks, and past performance is not indicative of future results. By accessing and using this website, you acknowledge and agree to the terms of this disclaimer.
The Strongest Market Signal
The two approaches to market timing—predictive and confirming—almost always give conflicting signals when analyzing movements of the same time domain. That is okay because they are used for different purposes and have different goals. If contrary opinion says that the market has reached bottom over the intermediate term, the other approach—trending indicators for the intermediate term—almost always indicates that the trend is still down. This is normal. Why? Because it is normal that investors become very bearish (furnishing us with buy signals using contrary opinion)as prices are plummeting and at their low. The large price drop makes the trend indicators point down, but the predictive indicators are showing that the end of the decline has been reached, and higher prices are ahead. However, there are times when the two approaches do not give conflicting signals, and these are very important to note. When predictive indicators such as contrary opinion strongly indicate higher prices, and the confirming indicators have already confirmed the start of a slight uptrend, that is the strongest buy signal there is. There is nothing more reliable or important than when this unusual situation happens. Why is this so? It is expected that, as prices move up, more and more investors will become bullish. When, however, the bearish sentiment stays high or even moves higher than prices also move higher, that is not expected, and so it is the sign of a very strong stock market. At these moments, what is happening is that no one believes the upward price movement is real or that it will last. This skepticism is the fuel needed to keep the movement going, usually for some time. The same holds true when both categories of indicators are confirming that prices are declining. If contrary opinion is extremely bullish and stock prices have already started down, so much so that trend-following indicators are confirming the downtrend, there is no more reliable or important sell indicator.
Continue reading